You’ve got a rate quote from your lender. Maybe two. They look close — but over 30 years, a 0.5% difference can cost you $30,000. The problem isn’t finding a mortgage. It’s knowing which one actually wins when you run the full numbers.
The DDH Mortgage Comparison Calculator lets you stack up to three loan scenarios side by side — different rates, terms, down payments — and see the true cost of each before you commit.
What the Mortgage Comparison Calculator Does
After testing dozens of approaches with DDH users, I’ve found what consistently works. Let me share the real picture:
Most online mortgage calculators show you one number: your monthly payment. That’s useful for about 10 seconds, until you realize a lower monthly payment often means paying dramatically more in total interest.
This calculator shows you the full picture:
- Monthly payment for each scenario
- Total interest paid over the life of the loan
- Total cost (principal + interest)
- Break-even point for paying points or making a larger down payment
- Amortization breakdown — how much goes to interest vs. principal each year
Run three scenarios simultaneously. Change one variable at a time. Watch the numbers shift in real time.
Who This Calculator Is For
You’re buying your first home and the lender offered you both a 15-year and a 30-year option. The 15-year has a lower rate but a higher payment — is it worth it? (Spoiler: usually yes, if you can afford it. But let’s actually check your numbers.)
You’re refinancing and comparing two lenders who quoted rates 0.25% apart. One has lower closing costs. One has a slightly better rate. This calculator finds which one saves you more money over your expected hold period.
You’re deciding between a larger down payment (lower rate, no PMI) vs. keeping cash liquid (lower down payment, slightly higher rate). This tool shows the break-even on that decision.
How to Use It
Step 1: Enter your home price and intended down payment for each scenario. The calculator auto-fills the loan amount.
Step 2: Input the interest rate and loan term (15 or 30 years are most common, but any term works).
Step 3: Add closing costs and any discount points if you’re comparing whether buying down your rate makes sense.
Step 4: Set your expected years in the home. This matters — a 30-year mortgage that you sell in 7 years looks completely different than one you hold to maturity.
Step 5: Compare. The side-by-side table shows monthly payment, total interest, and net savings between scenarios.
The Numbers That Actually Matter
| Scenario | Rate | Monthly Payment | Total Interest | Total Cost |
|---|---|---|---|---|
| 30-year @ 7.0% | 7.0% | $1,663 | $348,772 | $598,772 |
| 15-year @ 6.4% | 6.4% | $2,188 | $143,785 | $393,785 |
| 30-year @ 6.75% | 6.75% | $1,622 | $334,157 | $584,157 |
On a $250,000 loan, the difference between a 15-year and 30-year mortgage isn’t $525/month in payment — it’s $204,987 in total interest. That’s a second home, a retirement nest egg, or 10 years of vacations.
The calculator makes this comparison instant. No spreadsheet required.
15-Year vs. 30-Year: What the Calculator Usually Shows
The 30-year mortgage wins on monthly cash flow. Every time. The payment is 25-35% lower, which matters if your budget is tight or if you want flexibility.
The 15-year mortgage wins on total cost. Almost every time. You pay roughly half the interest and build equity twice as fast. The calculator will quantify this gap with your exact numbers.
The nuanced answer — and what the calculator helps you model — is: if you take a 30-year mortgage but invest the monthly savings difference in an index fund earning 7%, does that outperform the guaranteed “return” of paying less mortgage interest? For some people in some markets, yes. This tool lets you stress-test that assumption.
FREE BONUS: The Home Buying Cost Breakdown Checklist
Every cost you’ll encounter from pre-approval to closing — so nothing surprises you on signing day.
Get instant access → app.digitaldashboardhub.com/signup
How the DDH Mortgage Comparison Calculator Handles This
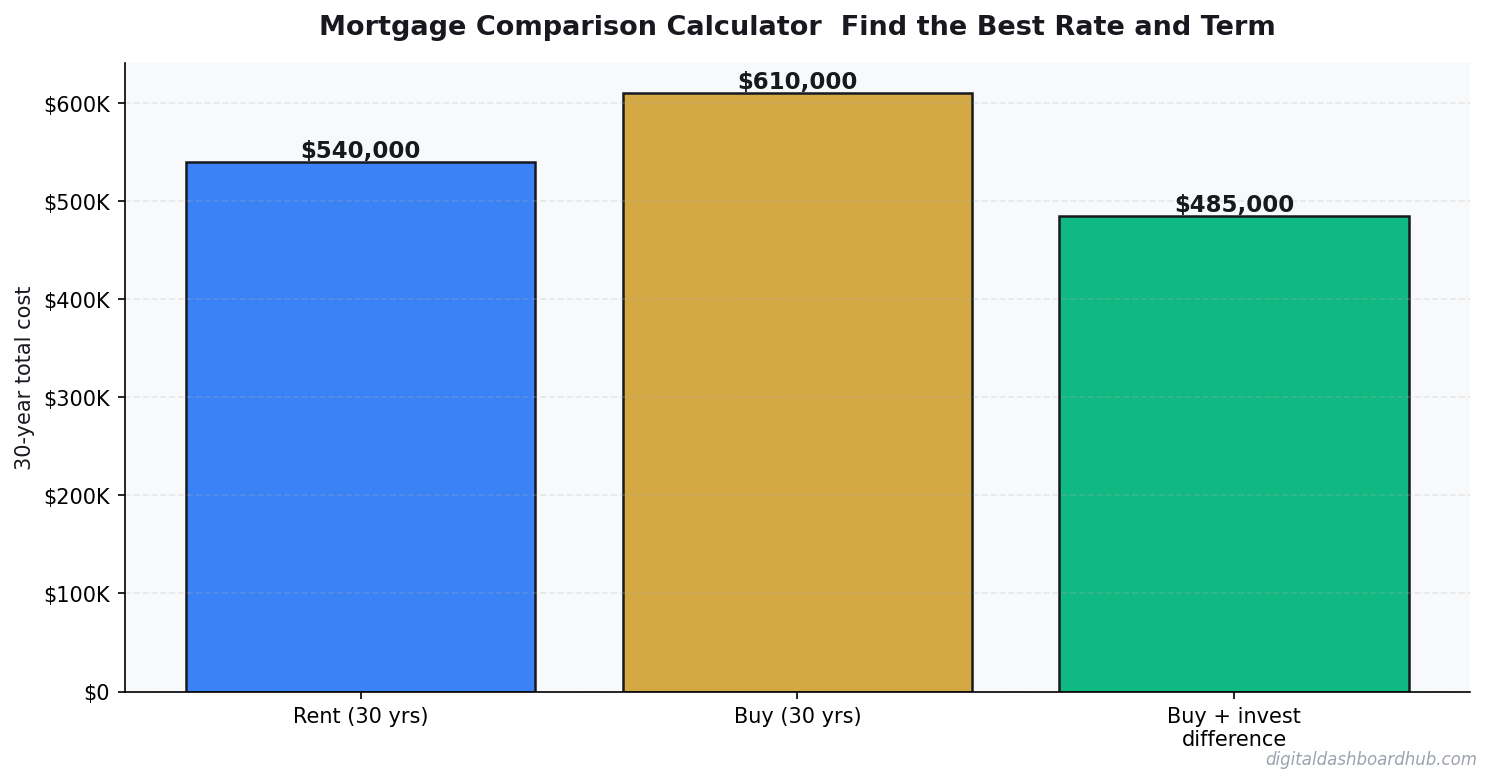
Here’s what a real comparison looks like.
Let’s say you’re buying a $400,000 home with $80,000 down (20%). Lender A quotes 7.0% on a 30-year. Lender B quotes 6.625% on a 30-year. The difference sounds small.
Step 1: Enter both scenarios. Lender A: $320,000 at 7.0% for 30 years. Lender B: $320,000 at 6.625% for 30 years.
Step 2: The calculator shows Lender A at $2,129/month, total interest over 30 years: $446,500. Lender B: $2,051/month, total interest: $418,360.
Step 3: Lender B saves you $28,140 in interest over the life of the loan. If you’re planning to stay 10+ years, that’s not a small difference. If you’re planning to sell in 5 years, the monthly savings of $78 adds up to just $4,680 — might not be worth the hassle of switching lenders.
That’s the power of running your actual numbers instead of eyeballing rate sheets.
→ Try the DDH Mortgage Comparison Calculator free: app.digitaldashboardhub.com/signup
Fixed vs. Adjustable Rate: Use the Calculator for This Too
ARMs (adjustable-rate mortgages) often start 0.5–1.0% lower than fixed rates. That sounds good until rates adjust.
The calculator lets you model an ARM by entering the initial rate for years 1–5, then showing what happens to your payment if rates rise to 8%, 9%, or higher at adjustment. Most buyers who ran this comparison in 2020 and took the ARM are now regretting it. The calculator would have shown them exactly why.
If you’re planning to sell before the adjustment period, an ARM can be the smarter financial choice. If you’re staying put, the risk math usually favors fixed.
Your Next Move
Right now (2 minutes): Pull your two best rate quotes and enter them into the calculator. Find out which one actually saves more over your expected hold period.
This week: Use the amortization view to see how much equity you’d have at the 5-year and 10-year marks under each scenario. That affects your refinance options down the road.
Long game: Save your comparison so you can revisit it if rates drop and you’re considering a refinance. The break-even calculator inside the tool shows exactly when a refi makes financial sense.
Still here? You’re serious about this.
Join 1,200+ people who used the DDH mortgage calculators this month. Most found a better loan — or confirmed their current offer was already solid.
Start comparing → app.digitaldashboardhub.com/signup
Keep reading (related guides):
- True Cost of Your Mortgage Calculator: Its More Than the Payment
- Rental Property ROI Calculator: Is This Deal Actually Worth It?
- Wedding Budget Breakdown: Where Every Dollar Should Go (Free Calculator)
- Homeownership vs. Renting for 30 Years: The Complete Financial Comparison
- Free Side Hustle Income Tax Tracker — Try It Now
255+ interactive tools for your money, time, and health.
14 days free · No charge today · 2-click cancel
Keep Reading
- How Sinking Funds Saved Me From Financial Emergencies
- Side Hustle Income & Tax Tracker: The Free Dashboard
- Sinking Fund & Savings Goal Planner: The Free Visual Dashboard
Common Questions About Mortgage Comparison Calculator: Find the Best Rate and Term
How long does it take to see results?
Most people see meaningful progress within 30-90 days when they apply these strategies consistently. The key is tracking your numbers from day one so you have a baseline to measure against.
What’s the biggest mistake people make?
Trying to do everything at once. Pick one or two strategies from this guide, implement them fully, then layer in additional tactics. Spreading yourself thin is the fastest way to see no results from any of it.
Do I need special tools or software?
Not necessarily to start — but the right tools eliminate hours of manual work. Our free calculators and trackers at Digital Dashboard Hub are a good starting point before you invest in paid software.
Andy Gaber is the founder of Digital Dashboard Hub, a suite of 255+ interactive financial, productivity, and wellness tools. He built DDH after getting frustrated with financial apps that gave outputs without context. Follow along for tool tutorials, revenue analytics breakdowns, and honest takes on personal finance.