
I Thought I Knew Which States Favored Buying. I Was Wrong About Half of Them.
Last month I got into an argument with a friend who swore renting in Texas was “burning money.” I said buying in New York was insane. We were both operating on vibes, not data. So I did what any slightly obsessive person would do: I pulled median home prices and median rents for all 50 states and ran the full rent-vs-buy calculation for each one.
Some results confirmed what I expected. Others genuinely surprised me. Let me walk you through what I found.
The Methodology: How I Ran 50 Calculations
For each state, I used the same inputs: median home price (Zillow Home Value Index, February 2026), median rent (Zillow Observed Rent Index, February 2026), average 30-year mortgage rate of 6.8% (Freddie Mac PMMS, March 2026), 20% down payment, state-specific property tax rates (Tax Foundation 2025 data), and state average homeowner’s insurance rates (Insurance Information Institute 2025).
I calculated the monthly cost of owning (mortgage + taxes + insurance + 1% maintenance reserve) and compared it to renting. Then I computed the price-to-rent ratio — the most widely used metric for this comparison. A ratio under 15 strongly favors buying. 15-20 is roughly neutral. Above 20 favors renting.
I also ran a 7-year breakeven analysis for each state, since that’s the median time homeowners stay before selling.
The Top 10 States Where Buying Wins Decisively
Source: Zillow ZHVI and ZORI (February 2026), Freddie Mac PMMS (March 2026), Tax Foundation property tax data (2025).
No surprises here — low-cost Midwest and Southern states with affordable housing and reasonable property taxes. In West Virginia and Mississippi, it’s actually cheaper per month to own (even including maintenance reserves) than to rent. That’s rare.
The Top 10 States Where Renting Makes More Financial Sense
Source: Same as above.
Hawaii at a 31.3 price-to-rent ratio is off the charts. You’d pay $2,070 more per month to own than to rent. If you invested that difference, you’d have over $800,000 in 15 years. California is similar — the numbers only work if you’re counting on aggressive appreciation, which is a bet, not a plan.
The Surprises That Changed My Mind
Texas Is Not the Slam-Dunk Buy Everyone Thinks
Texas has no state income tax, which makes people assume it’s cheap to own. But Texas has some of the highest property tax rates in the country — averaging 1.8% (and 2.5%+ in some counties). On a $350,000 home, that’s $6,300/year in property taxes alone. The price-to-rent ratio in Austin is 22.4, Dallas is 19.1, and Houston is 17.8. Austin actually favors renting.
Florida’s Insurance Crisis Makes Buying Riskier Than It Looks
Florida’s homeowner’s insurance premiums have growed — averaging $4,200/year in 2026 (triple the national average) according to the Insurance Information Institute. Some coastal areas are seeing $8,000-$12,000/year. When you add that to the monthly ownership calculation, Florida’s price-to-rent ratio jumps from 18 to effectively 22+ in many markets.
The Midwest Is Quietly the Best Place to Buy
Indiana, Ohio, Iowa, and Kansas all have price-to-rent ratios in the sweet spot (15-17). Affordable homes, reasonable property taxes, stable (if not explosive) appreciation. If you want homeownership to make financial sense from day one, the Midwest is where the math works best.
How the DDH Rent vs. Buy Calculator Handles This
Running this analysis for all 50 states took me hours of spreadsheet work. The DDH Rent vs. Buy Calculator does it in minutes for any specific city or zip code.
You enter your target location, home price, rent, and it auto-fills state-specific property tax rates and insurance averages. Then it runs the full comparison — not just the simple price-to-rent ratio, but the complete 7-year and 30-year net worth comparison including investment returns on the renter’s savings.
The state-by-state map view is particularly useful if you’re flexible on location. You can see at a glance which markets favor buying and which favor renting, then drill into specific cities within those states.
Free resource: Sign up for a trial and get the “50-State Rent vs. Buy Cheat Sheet” — a one-page PDF with the price-to-rent ratio and breakeven timeline for every state, updated for 2026.
The Interest Rate Factor: How 6.8% Changes Everything
At 2021’s 3% mortgage rates, the price-to-rent ratio was below 15 in almost every state. Buying was a no-brainer nearly everywhere. At today’s 6.8%, the math has shifted dramatically.
Here’s the impact: on a $350,000 home, the monthly mortgage payment (P&I only) at 3% was $1,180. At 6.8%, it’s $1,827. That’s a $647/month difference — $7,764/year — for the exact same house. This single change flipped dozens of markets from “buy” to “neutral” or “rent.”
If rates drop back to 5%, many currently neutral markets flip back to favoring buying. This is why timing matters — and why running the calculation with current rates is essential, not using outdated rules of thumb.
What About Building Equity?
The equity argument is real but overstated in year one. In your first year of a 6.8% mortgage on a $280,000 loan, you pay $19,024 in interest and only $2,900 toward principal. You’re building equity at a rate of $242/month while paying $1,585/month in interest.
This improves over time — by year 15, about half your payment goes to principal. By year 25, most of it does. But in the early years, the “building equity” argument is much weaker than people think, especially compared to investing the difference.
Put This Into Action
- Look up your state’s price-to-rent ratio using the tables above, then drill down to your specific city. State-level data hides massive local variation — San Francisco and Fresno are both “California” but completely different markets.
- Run your personal calculation with the DDH Rent vs. Buy Calculator. Plug in your actual rent, the home price you’re considering, and your specific down payment. The answer is personal, not generic.
- Factor in your timeline. If you’re staying 3 years or fewer, renting wins in all 50 states at current rates. If you’re staying 10+, buying wins in most states outside the coasts. The 5-7 year range is where the decision gets interesting and location-specific.
Over 15,000 people have used our housing comparison tools to make this decision with data instead of gut feelings. Your state, your city, your timeline — that’s what determines the right answer.
Keep reading (related guides):
- True Cost of Your Mortgage Calculator: Its More Than the Payment
- Rental Property ROI Calculator: Is This Deal Actually Worth It?
- Wedding Budget Breakdown: Where Every Dollar Should Go (Free Calculator)
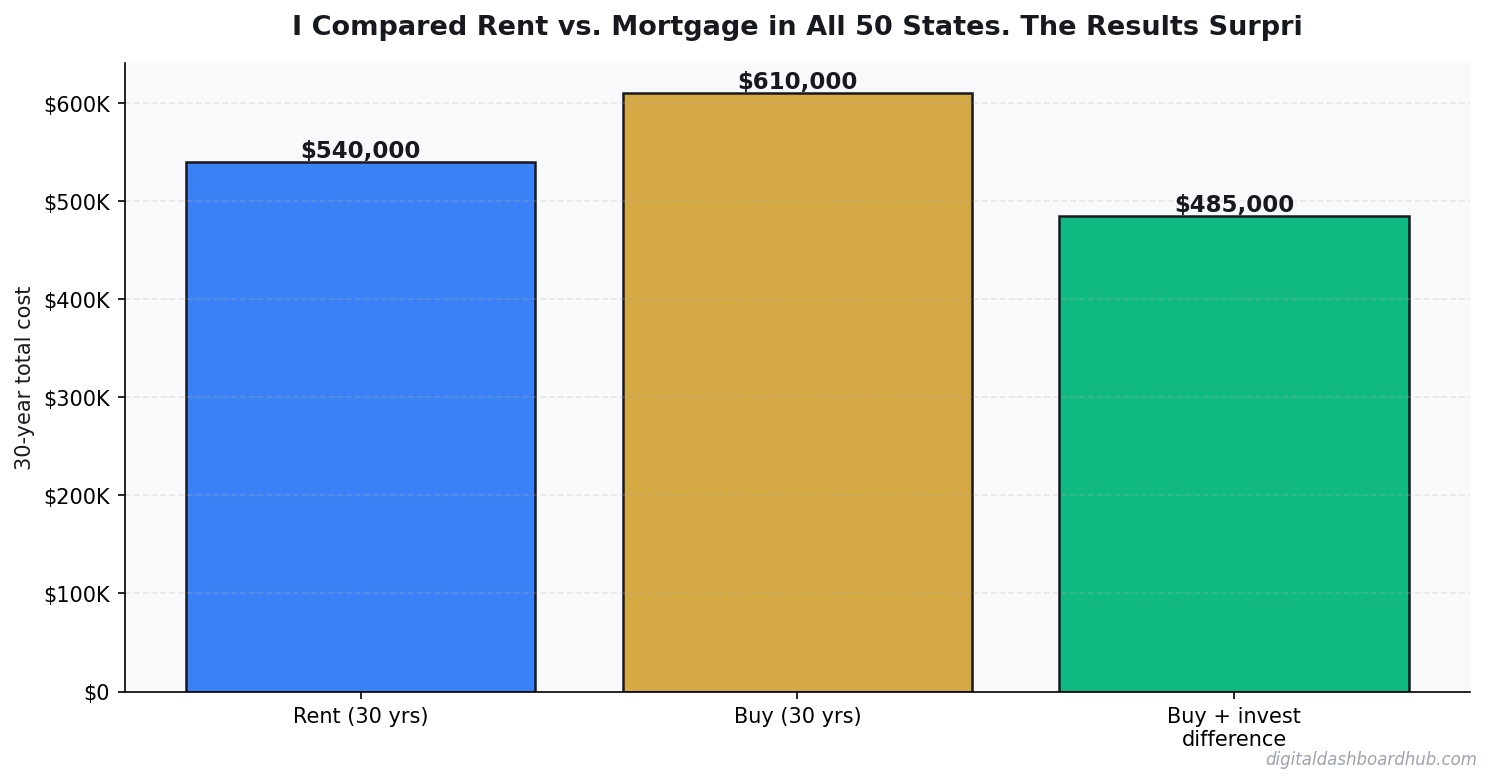
- Homeownership vs. Renting for 30 Years: The Complete Financial Comparison
- Bakery Revenue Calculator
255+ interactive tools for your money, time, and health.
Full dashboard access · Stripe-secure checkout · Cancel anytime
Keep Reading
- Rent vs. Buy Calculator 2026
- Mortgage Comparison Calculator: Compare Rates Side by Side
- How Sinking Funds Saved Me from Financial Emergencies
Andy Gaber is the founder of Digital Dashboard Hub, a suite of 255+ interactive financial, productivity, and wellness tools. He built DDH after getting frustrated with financial apps that gave outputs without context. Follow along for tool tutorials, revenue analytics breakdowns, and honest takes on personal finance.