One of These Paths Costs $300,000 More Over 30 Years — But It’s Not the One You’d Guess
Everyone has an opinion on renting vs. buying, and almost nobody has run the actual 30-year numbers. Your uncle says buying builds wealth. Your friend in Brooklyn says they’ve invested the difference and are ahead. They might both be right — because the answer depends on about 8 variables that almost nobody accounts for simultaneously. A mortgage payment vs. rent check comparison is like judging an iceberg by its tip.
I built a full 30-year model for both scenarios, including every cost I could find. The results genuinely surprised me, and I’ve been writing about personal finance for years.
30-Year Scenario: Buy vs. Rent + Invest
Assumptions: $400,000 home, 20% down ($80,000), 6.75% rate, 30-year fixed. Comparable rent: $2,000/month. Both individuals earn the same income and start with $80,000 in savings.
In this scenario, the homeowner spends $172,000 more in total housing costs but ends up with $339,000 more in net worth. Buying wins — but only because the home appreciated at 3.5% annually and the owner stayed for the full 30 years.
When the Numbers Flip
Change a few variables and renting wins decisively:
The three biggest factors: how long you stay, how fast your home appreciates, and what comparable rent costs. Everything else is noise.
The Hidden Advantages of Each Path
Owning: The Advantages Nobody Quantifies
- Forced savings: Every mortgage payment builds equity. Most Americans are terrible at voluntary savings. Homeownership forces it. This is arguably the biggest financial benefit for most people.
- Fixed housing cost (mostly): Your principal and interest never change on a fixed-rate mortgage. Rent increases by 3-5% annually in most markets. After 15 years, your fixed payment feels cheap while rents have nearly doubled.
- Tax benefits: Mortgage interest deduction (if you itemize), property tax deduction (up to $10K SALT cap), and $250K/$500K capital gains exclusion when you sell.
Renting: The Advantages Nobody Admits
- Liquidity: Your $80K down payment stays invested and accessible. Try pulling $80K out of your house in 30 days — you can’t without selling or borrowing.
- Zero maintenance risk: A new roof ($10,000-$20,000), HVAC replacement ($8,000-$15,000), or foundation issue ($5,000-$30,000) is your landlord’s problem, not yours.
- Mobility: Career opportunities in another city? Lease ends and you move. Homeowners face 6% selling costs, months of listing time, and potential market losses.
Want to model your specific situation? The 30-year cost calculator from Digital Dashboard Hub lets you input your exact home price, rent, down payment, tax rate, and expected returns. It builds year-by-year projections for both paths so you can see exactly when (or if) buying pulls ahead.
The Real Answer: It Depends on Five Things
- Time horizon: Staying 10+ years? Buying usually wins. Under 5 years? Renting almost always wins.
- Local market: Price-to-rent ratio above 20? Renting favors you. Below 15? Buying favors you.
- Your savings discipline: If you won’t actually invest the difference while renting, buying’s forced savings wins by default.
- Life flexibility needs: If your career might move you, the mobility cost of homeownership is real and expensive.
- Emotional value: Some people sleep better owning their walls. That’s not irrational — it’s just not a spreadsheet line item.
Your Next Move
- Right now: Calculate your local price-to-rent ratio. Take the median home price in your area and divide by annual rent for a comparable place. Above 20 = renting likely wins. Below 15 = buying likely wins. Between 15-20 = you need a calculator.
- This week: Run both scenarios through a 30-year cost comparison calculator using your real numbers — not national averages. The difference between “average” and “your situation” can be hundreds of thousands.
- Long game: Whatever you choose, the key is doing something with the money you’re not spending. Owners should avoid treating their home as their only investment. Renters must actually invest the down payment and monthly savings — or buying wins on autopilot.
Over 2,000 people have modeled their rent-vs-own decision using our tools. The calculator doesn’t have an opinion — it just shows you the math for your specific life. Run your 30-year comparison free.
The Variables Most People Ignore (and Why They Change Everything)
Here’s where the buy-vs-rent math gets complicated — and where most online calculators lie by omission.
Opportunity cost. When you put $80,000 down on a house, that capital is tied up. If the same $80,000 earns 7% annually in an index fund, it doubles roughly every 10 years. That’s the real cost of the down payment — not just the cash itself, but what it would have earned instead.
Maintenance reality. The standard rule of thumb is 1-2% of home value per year in maintenance. On a $400,000 home, that’s $4,000-8,000 annually — a number that doesn’t show up in mortgage calculators, but absolutely shows up in your bank account.
Rent investment discipline. The “renter investing the difference” scenario only works if you actually invest the difference. Most renters don’t. If you’re not disciplined about it, the homeownership math looks much better by default.
Local market conditions. The 30-year comparison looks completely different in San Francisco (where price-to-rent ratios favor renting) vs. the Midwest (where buying often wins decisively). Run this calculator with your actual local numbers, not national averages.
| Factor | Favors Buying | Favors Renting |
|---|---|---|
| Price-to-rent ratio | Below 15x | Above 20x |
| Time horizon | 7+ years | Under 5 years |
| Investment discipline | Low (won’t invest the difference) | High (will invest the difference) |
| Local appreciation history | Strong (3-5%+ annually) | Flat or declining market |
| Mortgage rate environment | Under 5% | Above 7% |
The DDH calculator accounts for all of these. Put in your real numbers and see where the 30-year line actually lands for your specific situation — not someone else’s.
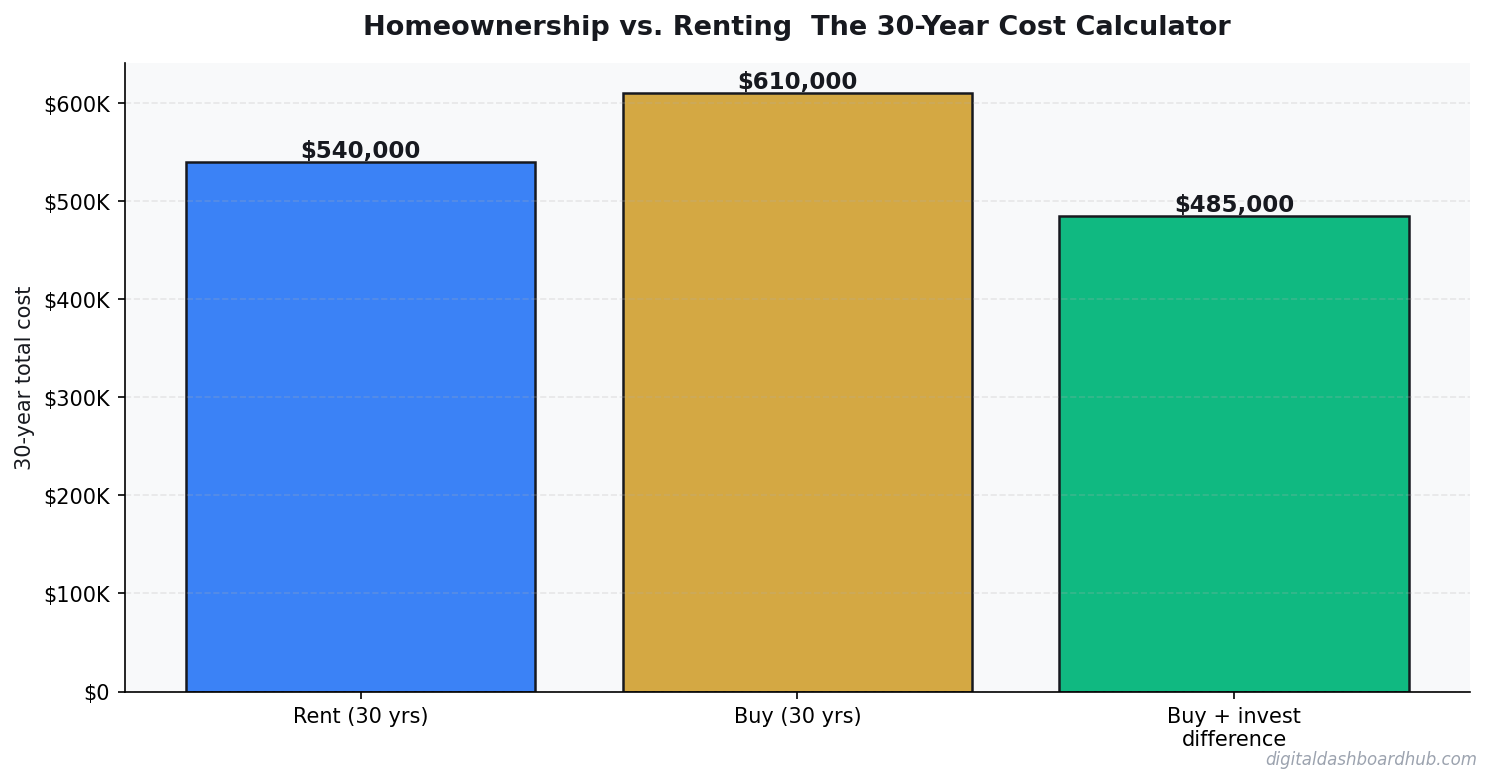
A Real 30-Year Comparison: Denver, Colorado
In 2026, a 1,400 sq ft home in suburban Denver costs approximately $485,000. Renting an equivalent unit: $2,400/month. Let me run the actual 30-year math instead of the usual hand-wavy “owning builds equity” argument.
Renting scenario: $2,400/month, assuming 3% annual rent increases. Total rent paid over 30 years: ~$1,140,000. If you invest the down payment equivalent ($97,000 at 20%) at 7% average annual return, it grows to $739,000. Plus invest the difference between ownership costs and rent costs (assuming $600/month in years 1–10): additional $285,000. Total renter wealth: approximately $1,024,000.
Owning scenario: $485,000 home, 20% down, 30-year mortgage at 6.8%. Monthly payment: $2,537. Add property tax ($500/month), insurance ($180/month), maintenance (1% of value/year = $404/month): total monthly cost $3,621 in year 1. Home appreciates 3.5%/year. After 30 years, home value: ~$1,365,000 with ~$485,000 paid in mortgage interest and ~$292,000 in tax/insurance/maintenance. Net equity: approximately $975,000 — plus the home is paid off.
The difference is surprisingly small, and it’s location-dependent. In slower-appreciation markets, renting wins. In high-appreciation markets (Austin 2010–2020, coastal metros), owning wins decisively. The calculator tells you which scenario applies to your market.
One variable the calculator can’t capture: the psychological cost of housing uncertainty. Renters in tight markets face lease non-renewals, landlord sales, and year-to-year price jumps that disrupt lives in ways a 30-year spreadsheet doesn’t reflect. Ownership offers stability that has real financial value even when the pure numbers are close — especially if you have children in school or a business rooted in a specific location. Run the math, then weigh the non-financial factors honestly.
Keep reading (related guides):
- True Cost of Your Mortgage Calculator: Its More Than the Payment
- Rental Property ROI Calculator: Is This Deal Actually Worth It?
- Wedding Budget Breakdown: Where Every Dollar Should Go (Free Calculator)
- Homeownership vs. Renting for 30 Years: The Complete Financial Comparison
- Bakery Revenue Calculator
255+ interactive tools for your money, time, and health.
Full features for 14 days · Secure payment · Stop anytime
Keep Reading
- Rent vs. Buy Calculator 2026
- Mortgage Comparison Calculator: Compare Rates
- How Much Money to Retire Early by Age
Andy Gaber is the founder of Digital Dashboard Hub, a suite of 255+ interactive financial, productivity, and wellness tools. He built DDH after getting frustrated with financial apps that gave outputs without context. Follow along for tool tutorials, revenue analytics breakdowns, and honest takes on personal finance.