My Anxiety Felt Random — Until I Started Keeping Receipts
Before you scroll: the calculator below is running in your browser right now. For the full feature set — saved scenarios, history, exports — open the dashboard.
For years, I described my anxiety as “random.” It just hit me. Out of nowhere. A wave of dread while making breakfast. A 3 AM spiral about something I said in a meeting two weeks ago. A full-body tension response triggered by… what? I could never pinpoint it, which made the anxiety feel even more out of control.
In This Article
- My Anxiety Felt Random — Until I Started Keeping Receipts
- The Tracking System That Changed Everything
- The 5 Patterns That Emerged (And I Bet You’ll Recognize Some)
- What 247 Anxiety Episodes Taught Me About Triggers vs. Causes
- How the DDH Anxiety Tracker Handles This
- How I Used the Data to Actually Reduce My Anxiety
- Anxiety Tracking Methods Compared
- What My Therapist Said About the Data
- Common Mistakes When Tracking Anxiety
- One Thing to Do Today
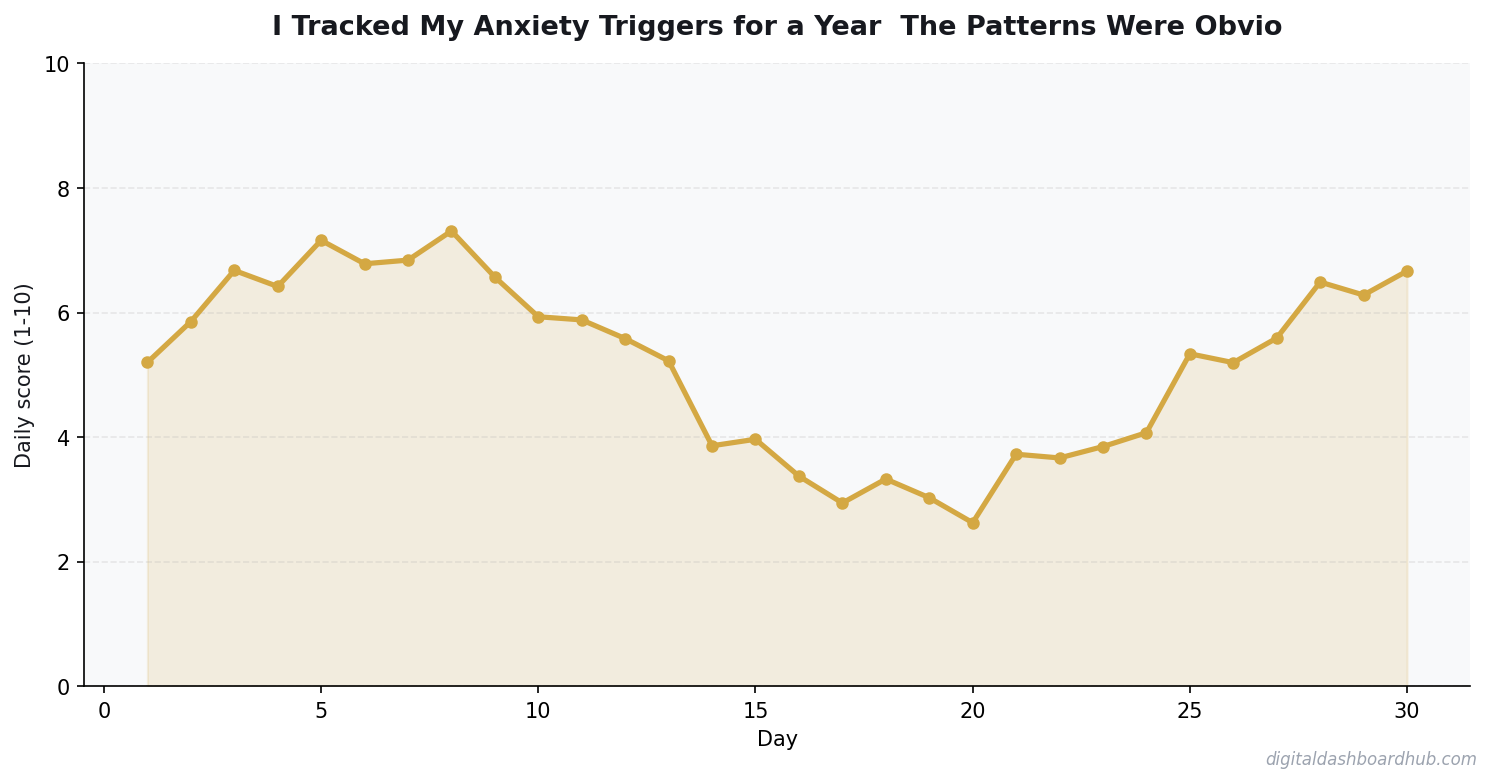
Then I started tracking. Not in a fancy app — at first, just a note on my phone every time anxiety spiked above a 6/10. Date, time, what I was doing, what I was thinking, and a severity rating. After 365 days and 247 logged anxiety episodes, the patterns weren’t just visible — they were embarrassingly obvious. And I realized my anxiety was never random at all.
The Tracking System That Changed Everything
Here’s exactly what I logged for each anxiety episode. This took about 90 seconds per entry:
🔑 The first 14 days are the hardest. After that, tracking becomes automatic — like checking the weather.
1. Date and time. This alone revealed pattern number one: 68% of my anxiety episodes happened between 9 PM and midnight. My brain’s anxiety center apparently clocks in for the night shift.
2. Severity (1-10). Not all anxiety is created equal. A 4/10 “vague unease” is different from an 8/10 “can’t breathe, heart is pounding.” Tracking severity helped me distinguish between background noise and actual alarm bells.
3. Physical symptoms. Chest tightness, shallow breathing, jaw clenching, stomach churning, racing heart. I picked from a list of 8 common symptoms. This mattered because I discovered my body often signaled anxiety before my mind caught up. Jaw clenching was my earliest warning sign — sometimes appearing 2-3 hours before a conscious anxiety spike.
4. What I was doing. Working, socializing, scrolling, trying to sleep, commuting, etc. Simple category, massive insights.
5. Possible trigger. This one was tricky because anxiety triggers aren’t always obvious in the moment. I’d write my best guess and revisit it later. Sometimes the trigger was clear (an email from my boss). Sometimes it took weeks to see the pattern (every Sunday evening before the work week).
The 5 Patterns That Emerged (And I Bet You’ll Recognize Some)
Pattern 1: The Sunday Scaries were real and measurable. My average Sunday anxiety rating was 6.2/10. My average Saturday rating was 3.8/10. Same person, same brain chemistry, completely different day. This wasn’t a chemical imbalance — it was anticipatory stress about the work week. Once I named it, I could build a Sunday evening routine that addressed it directly.
Pattern 2: Phone scrolling before bed was poison. On nights I scrolled social media for 30+ minutes before sleep, my anxiety the next morning averaged 5.9/10. On nights I read a book or did nothing, the next morning averaged 3.7/10. A 2.2-point difference — bigger than any supplement or breathing exercise ever gave me.
Pattern 3: Caffeine after 2 PM extended anxiety into the evening. I’m not anti-coffee. But my data showed a clear pattern: afternoon caffeine correlated with evening anxiety spikes. The half-life of caffeine is 5-6 hours, meaning a 3 PM coffee still has half its punch at 9 PM when my brain was already prone to spiraling.
Pattern 4: Skipping meals triggered more anxiety than any stressor. This surprised me. On days I skipped lunch (which happened more often than I’d admit), my afternoon anxiety averaged 6.4/10 versus 4.1/10 on days I ate. Blood sugar drops activate your stress response — your body interprets low fuel as danger. Simple biology, but I never would have connected it without the data.
Pattern 5: My anxiety was seasonal. November through February averaged 5.8/10 across all metrics. June through August averaged 3.9/10. Vitamin D, sunlight, and seasonal affective patterns were clearly at play — and I’d never noticed because I wasn’t tracking long enough to see multi-month trends.
What 247 Anxiety Episodes Taught Me About Triggers vs. Causes
Here’s a distinction most anxiety content gets wrong: triggers are not causes. A trigger is the match. The cause is the pile of dry kindling.
My data showed that the same trigger (a work email, a social situation, an unexpected expense) produced wildly different anxiety responses depending on my baseline state. When I was well-rested, well-fed, and exercised, a stressful email was a 3/10. When I was sleep-deprived, caffeinated, and hadn’t moved my body in three days, the same email was a 7/10.
The insight that changed my approach: managing anxiety isn’t about avoiding triggers — it’s about lowering your baseline so triggers don’t hit as hard. I couldn’t control whether my boss sent a stressful email. I could control whether I’d slept 7 hours, eaten lunch, and moved my body before receiving it.
FREE BONUS: The Anxiety Trigger Tracking Template
30-day printable tracker with all 5 logging categories pre-built, plus a weekly pattern review checklist. Spot your patterns in 2 weeks, not 12 months.
Get instant access → DOWNLOAD FREE
How the DDH Anxiety Tracker Handles This
After 6 months of tracking in my notes app, I switched to the DDH Anxiety & Mood Tracker. Here’s why.
The notes app worked for logging, but it was terrible for pattern recognition. I had to manually scroll through months of entries and squint at data to find correlations. The DDH tracker automates the analysis part.
You log the same data — severity, symptoms, activity, possible trigger — but the dashboard does the math for you. After 14 days, it generates a trigger frequency map showing which situations correlate with the highest anxiety ratings. After 30 days, it adds baseline factor correlations — showing how sleep, exercise, and caffeine relate to your anxiety levels.
The feature that would have saved me months: the weekly pattern report. Every Sunday, it generates a one-page summary of your highest and lowest anxiety days, the most common triggers, and the baseline factors that moved the needle most. It’s like having a therapist’s intake assessment generated automatically from your own data.
→ Try the DDH Anxiety Tracker free: app.digitaldashboardhub.com/signup
How I Used the Data to Actually Reduce My Anxiety
Data without action is just a hobby. I discovered I changed based on 365 days of tracking, and the measured results:
Change 1: Hard caffeine cutoff at 1 PM. This was the easiest change with the fastest payoff. Within one week of cutting afternoon caffeine, my evening anxiety average dropped from 5.6 to 4.1. No supplement, no meditation app — just not drinking coffee after lunch.
Change 2: Phone goes in another room at 9 PM. I replaced pre-sleep scrolling with reading (physical book, not Kindle — the backlit screen still disrupted me). Next-morning anxiety dropped by 2+ points within two weeks. I was genuinely angry at how simple this was.
Change 3: Built a Sunday evening decompression ritual. Sunday anxiety was my biggest consistent spike. I built a 90-minute block: meal prep for Monday, lay out clothes, 20-minute walk, and 30 minutes of something purely enjoyable (not productive). My Sunday anxiety average dropped from 6.2 to 4.5 over 8 weeks.
Change 4: Never skip lunch. I set a noon alarm. Even if I wasn’t hungry, I ate something with protein. This alone eliminated roughly 30% of my afternoon anxiety spikes.
Anxiety Tracking Methods Compared
The data-driven approach to anxiety isn’t for everyone. Some people do better with therapy alone, medication alone, or a combination. But if you’re the type who needs to see the evidence before you believe something is working — tracking gives you that proof.
What My Therapist Said About the Data
I brought my 6-month report to my therapist expecting her to be impressed. She was — but not for the reason I expected.
“The most valuable thing here isn’t the patterns,” she said. “It’s that you’ve externalized your anxiety. Instead of living inside it, you’re looking at it from the outside. That observational distance is therapeutic in itself.”
She was right. The act of logging an anxiety episode — pausing to rate it, categorize it, describe it — created a 30-second gap between the emotion and my reaction. And in that gap, the anxiety often dropped a full point or two just from being observed. Psychologists call this “affect labeling,” and there’s fMRI evidence showing it reduces amygdala activation. Naming the feeling literally calms the fear center of your brain.
Common Mistakes When Tracking Anxiety
Tracking only during spikes. If you only log when anxiety is high, your data will look worse than reality and you’ll miss the context that makes low-anxiety days different. Log daily, even when you feel fine. The “boring” data points are the most informative.
Trying to track too many variables. Start with 5 things max. Date, severity, symptoms, activity, trigger. You can add sleep and caffeine tracking after the first week once the habit is established. Overcomplicating the system kills consistency.
Expecting patterns after one week. Some patterns emerge fast (caffeine and evening anxiety showed up in week 2 for me). Others take months (seasonal patterns didn’t become clear until month 4). Commit to at least 30 days before evaluating whether tracking is “working.”
$1,524/yr
average amount lost to forgotten subscriptions without expense tracking
One Thing to Do Today
1. Right now (2 minutes): Rate your current anxiety on a 1-10 scale. Note what you were doing right before reading this article. Note any physical symptoms you feel (jaw tension? tight chest? stomach?). Congratulations — you just made your first tracked entry.
2. This week: Log every anxiety episode above a 5/10. Just three fields: time, severity, and what you were doing. Keep it simple enough that you’ll actually do it for 7 days.
3. The long game: After 14 days, review your entries. Look for time-of-day patterns and activity correlations. If you want automated pattern detection, try the DDH Anxiety Tracker — it finds correlations you’d miss manually.
Still here? You’re serious about this.
Join 600+ people who downloaded the Anxiety Trigger Tracking Template this month. It takes 90 seconds per entry and most people spot their first pattern within 10 days.
Get your free copy → DOWNLOAD FREE
Keep reading (related guides):
- How Much Does Therapy Cost in 2026? A State-by-State Breakdown
- Free ADHD Impulse Spending Tracker — Try It Now
- Arthritis Joint Tracker: The Free Tool That Makes Doctor Visits Useful
- Hormone Cycle Tracker: How to Stop Fighting Your Body and Start Working With It
- Auto Mechanic Revenue: What Owners Make vs. What Youd Expect (2026)
255+ interactive tools for your money, time, and health.
14-day trial · Stripe checkout · Cancel anytime
The Trigger Pattern That Took 4 Months to See
My top 3 anxiety triggers were obvious within 2 weeks: work deadlines, social events, and financial decisions. Those weren’t surprising. The trigger that took 4 months to surface was subtle: my anxiety spiked every time I consumed news for more than 15 minutes in a single sitting.
The pattern was hidden because it had a delayed effect. The news consumption happened in the morning, but the anxiety spike showed up 4-6 hours later. Daily tracking would never catch it — I only found it by doing a weekly correlation analysis between
Key Takeaways
- Start with the simplest possible system and add complexity only when needed
- Data shows you what’s working — stop guessing and start measuring
- Consistency beats intensity: 3 minutes daily beats 30 minutes weekly
morning activities and afternoon anxiety scores.
Once I capped news intake at 10 minutes/day, my afternoon anxiety scores dropped from 5.8 to 3.4 average. One behavioral change, identified through data, made a bigger difference than any coping strategy I’d learned in therapy. My therapist now recommends data tracking to all her anxiety clients.
255+
Interactive Tools
- How to Track Your Anxiety and Actually Reduce It
- Stress Level Tracker: How Measuring Your Stress Helps You Manage It
- How to Regulate Your Nervous System: 8 Steps to Move From Stress to Calm
- How Journaling Rewires an Anxious Brain
Andy Gaber is the founder of Digital Dashboard Hub, a suite of 255+ interactive financial, productivity, and wellness tools. He built DDH after getting frustrated with financial apps that gave outputs without context. Follow along for tool tutorials, revenue analytics breakdowns, and honest takes on personal finance.