Every Coffee Shop Business Plan Has the Same Problem
The dashboard below loads instantly in your browser. Plug in your numbers, see your answer. No signup to try the basics.
You estimated 200 drinks a day because it “felt right.” That number is the difference between a $400K/year business and a $180K/year business, and you pulled it from thin air. I’ve reviewed dozens of coffee shop financial projections, and the drink count assumption is wrong in almost every single one.
The actual math isn’t complicated, but it requires honest inputs. Here’s how to project coffee shop revenue using real industry data — not vibes.
The Core Revenue Formula
Coffee shop revenue comes down to four numbers:
Daily Revenue = Customers Per Day × Average Ticket × Operating Days
Simple, right? The problem is each variable has a realistic range that most new owners overshoot.
Revenue by Location Type
Where you open determines your ceiling more than anything else you do. A coffee shop in a suburban strip mall and one in a downtown business district are completely different businesses.
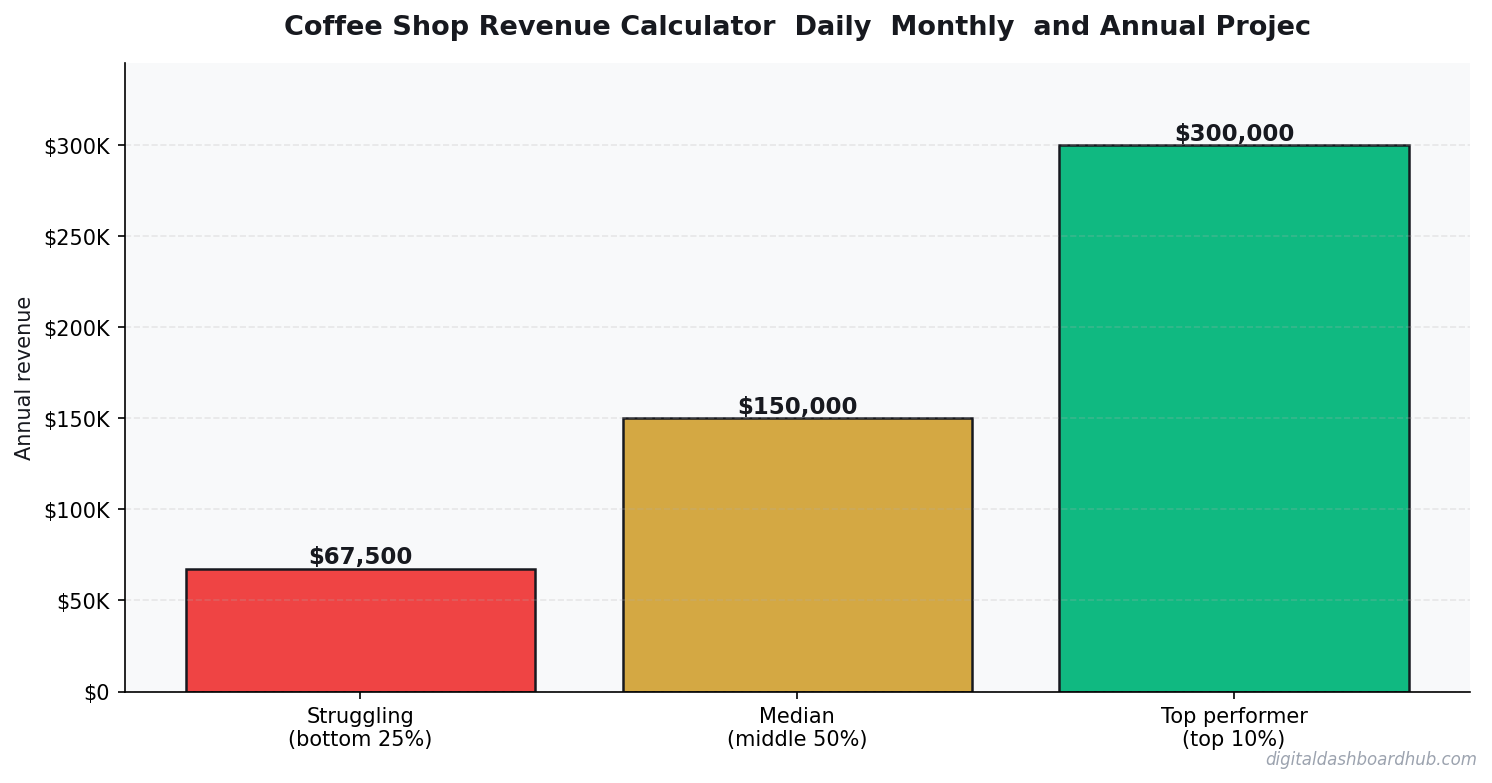
Drive-thru-only models consistently outperform sit-down shops on revenue per labor dollar. That’s not opinion — it’s the math on lower rent, fewer staff, and higher throughput.
The Expenses Nobody Warns You About
Revenue is the fun number. Here’s the one that determines whether you actually take money home.
Fixed Monthly Costs (Typical Range)
- Rent: $2,500-$8,000 (location dependent — this is your biggest lever)
- Loan payments: $1,200-$3,500 (on $150K-$400K buildout)
- Insurance: $300-$600
- Utilities: $800-$1,500 (espresso machines are power hungry)
- POS/Software: $150-$400
- Accounting: $200-$500
Variable Costs (As % of Revenue)
- Cost of goods (coffee, milk, cups, food): 28-35%
- Labor: 30-38% (the killer — most shops underestimate this by 10%)
- Credit card processing: 2.5-3.5%
- Waste/spoilage: 3-5%
- Marketing: 2-5%
Add it up: your total operating cost typically runs 75-85% of revenue. That means on $30,000/month in sales, you’re netting $4,500-$7,500 before taxes and your own salary. This is why coffee shops fail — not because of bad coffee, but because owners project $40K/month revenue and get $22K.
Your Free Revenue Projection Cheat Sheet
I built a one-page input sheet with every variable a coffee shop needs to model accurately. It includes the seasonal adjustment multipliers most calculators skip (December is not June). Grab it when you sign up for a free trial.
How to Actually Use These Numbers
Here’s the exercise that saved two shop owners I know from signing bad leases:
The Break-Even Reality Check
Take your total fixed monthly costs. Divide by your per-drink margin (ticket price minus COGS per drink). That’s how many drinks you need to sell per day just to cover overhead — before labor, before your salary, before profit.
Example: $6,500 fixed costs ÷ $3.25 margin per drink = 2,000 drinks/month = 67 drinks/day just to break even on fixed costs. Add labor at 35% of revenue and you need roughly 150 drinks/day to actually pay yourself.
If your location can’t realistically support 150 customers per day, the math doesn’t work regardless of how good your latte art is.
Seasonal Revenue Adjustments
Flat-line projections are fiction. Coffee shops see real seasonal swings:
- January-February: -15 to -20% (post-holiday slump, cold weather reduces foot traffic in some regions)
- March-May: Baseline
- June-August: -5 to +10% (iced drinks boost ticket, but foot traffic varies)
- September-October: +10 to +20% (pumpkin spice is not a joke — it moves numbers)
- November-December: +5 to +15% (gift cards, holiday drinks, catering)
A shop doing $25K/month baseline might swing between $20K in February and $30K in October. Your cash reserves need to handle the valleys.
Your Next Move
- Get your real customer count. Sit outside your target location for 3 days. Count foot traffic during operating hours. Assume 5-10% will walk in. That’s your honest starting number.
- Run the break-even math with your actual lease quote and COGS from a local supplier. If break-even requires more than 60% of your realistic customer count, the location is too expensive.
- Model three scenarios — pessimistic (60% of your target), realistic (80%), and optimistic (100%) — and make sure the pessimistic one doesn’t bankrupt you in 6 months.
Digital Dashboard Hub’s coffee shop revenue calculator lets you adjust every variable covered here — location type, menu pricing, seasonal curves, staffing models — and see projections update in real time. Over 500 business owners trust our calculators. Start your free trial and get your projection in under 5 minutes.
A Real Coffee Shop P&L: Austin, 8 Months In
Let’s look at a 900 sq ft specialty coffee shop in a mixed-use development in East Austin. Staff: 3 baristas + the owner working 5 days/week. Average ticket: $8.40. Daily transactions: 145.
- Daily gross revenue: $1,218
- Monthly gross: ~$36,540 (30 days)
- COGS (beans, milk, syrups, pastries): $9,500 (26%)
- Labor (including owner draw): $11,200 (31%)
- Rent: $4,200
- Utilities + internet: $900
- POS, insurance, misc: $650
- Net operating profit: ~$10,090/mo (27.6% margin)
That’s a genuinely good coffee shop margin. The national average for independents is 15-20%. The difference here is location (high foot traffic, no paid parking needed), ticket average above $8, and a menu that avoids complexity (no full food program killing labor).
The 3 Levers That Move Coffee Shop Revenue Most
Ticket Average, Not Transaction Volume
Most struggling coffee shops try to drive more customers. The operators I’ve watched turn it around almost always focus on ticket average first. Adding a $4 food pairing prompt at POS, training staff to upsell size upgrades, or adding one premium drink ($12-14) to the menu can move ticket average from $6.50 to $8.50 — a 31% revenue increase with the same customer count.
Afternoon Traffic
The morning rush is a given. The 2-5pm window is where coffee shops either win or lose. Shops that drive afternoon traffic with loyalty programs, happy hour pricing, or remote-worker amenities (good wifi, outlets, long tables) can run 60-70% of morning volume in the afternoon. Shops without a strategy see 20-30% of morning volume. That gap is worth $4,000-$8,000/mo in annual revenue for an average-sized shop.
Wholesale and Catering
A local roast program or office catering contract is pure margin. No retail overhead, no table turns, no barista labor at the counter. One office catering contract at $800/week adds $41,600/yr in revenue at 60%+ gross margin. Most coffee shop owners don’t pursue it because it feels like a different business. It’s actually the same business, minus the chaos.
Keep reading (related guides):
255+ interactive tools for your money, time, and health.
Full dashboard access · Stripe-secure checkout · Cancel anytime
Keep Reading
- Freelancer Finance Dashboard: Track Income, Taxes, and Cash Flow
- The Side Hustle Tax Trap: Track Every Dollar
- Sinking Fund Savings Goal Planner
Common Questions About Coffee Shop Revenue Calculator: Daily, Monthly, and Annual Projections
How long does it take to see results?
Most people see meaningful progress within 30-90 days when they apply these strategies consistently. The key is tracking your numbers from day one so you have a baseline to measure against.
What’s the biggest mistake people make?
Trying to do everything at once. Pick one or two strategies from this guide, implement them fully, then layer in additional tactics. Spreading yourself thin is the fastest way to see no results from any of it.
Do I need special tools or software?
Not necessarily to start — but the right tools eliminate hours of manual work. Our free calculators and trackers at Digital Dashboard Hub are a good starting point before you invest in paid software.
Andy Gaber is the founder of Digital Dashboard Hub, a suite of 255+ interactive financial, productivity, and wellness tools. He built DDH after getting frustrated with financial apps that gave outputs without context. Follow along for tool tutorials, revenue analytics breakdowns, and honest takes on personal finance.