Here’s a free dog grooming tool that actually works — no signup, no email capture wall, no “results hidden behind paywall” nonsense. Enter your numbers below and get instant results. If you want the full version with charts and reports, that’s available too.
Use the Free Dog Grooming Tool
Before you scroll: the calculator below is running in your browser right now. For the full feature set — saved scenarios, history, exports — open the dashboard.
What Makes This Different
Most free tools online are either broken, outdated, or just a landing page pretending to be a tool. I wanted something that gives you a real answer in under 60 seconds — no account required, no friction. The tool below does exactly that.
If you need more depth — historical tracking, scenario comparison, PDF exports — the full version inside Digital Dashboard Hub covers all of that. But the lite version below handles the basics right now.
The Dashboard Behind This Calculator
| Approach | Startup Cost | Time Investment | Revenue Potential | Best For |
|---|---|---|---|---|
| Solo operator | Low ($1K-$10K) | Full time | $60K-$200K/yr | Maximum margins, full control |
| Small team (2-5) | Medium ($10K-$50K) | Management + some fieldwork | $200K-$800K/yr | Scaling without losing control |
| DDH Revenue Tracker | Free trial | 5 min setup | N/A (profit tool) | Know your real numbers in real time |
The lite tool above gives you a quick answer. The full Dog Grooming Revenue Calculator inside Digital Dashboard Hub goes way deeper:
- Historical tracking — log your numbers weekly and watch trends emerge over months
- Visual charts — bar graphs, trend lines, and breakdowns that make patterns impossible to miss
- Scenario modeling — run “what if” comparisons side by side before making decisions
- PDF reports — export clean reports for partners, lenders, or your own records
- — one subscription covers every calculator and tracker in the library
How to Get the Most Out of This
Step 1: Enter your real numbers above. Estimates work, but real data from your bank statements or business records gives you something you can actually act on.
Step 2: Change one variable at a time and watch what happens. You’ll quickly see which lever moves your results the most — that’s where to focus your energy.
Step 3: If you want to save these results or track them over time, start a free 14-day trial of the full dashboard. No credit card required. Cancel anytime.
Take Action
- Right now (30 seconds): Bookmark this page so you can rerun the numbers next month
- This week: Gather your actual data and run it through the tool with real numbers instead of estimates
- Long game: Try the full DDH dashboard — 261 tools, 14 days free, cancel anytime
Related Tools and Articles
- Period Tracking 101: What Your Cycle Is Telling You About Your Health
- ADHD Impulse Spending Tracker: The Free Visual Dashboard Built for Your Brain
- How to Start an Amazon FBA Business: Month-by-Month Revenue Expectations
Common Questions About Free Dog Grooming Revenue Calculator — Estimate Your Profit in 60 Seconds
How long does it take to see results?
Most people see meaningful progress within 30-90 days when they apply these strategies consistently. The key is tracking your numbers from day one so you have a baseline to measure against.
What’s the biggest mistake people make?
Trying to do everything at once. Pick one or two strategies from this guide, implement them fully, then layer in additional tactics. Spreading yourself thin is the fastest way to see no results from any of it.
Do I need special tools or software?
Not necessarily to start — but the right tools eliminate hours of manual work. Our free calculators and trackers at Digital Dashboard Hub are a good starting point before you invest in paid software.
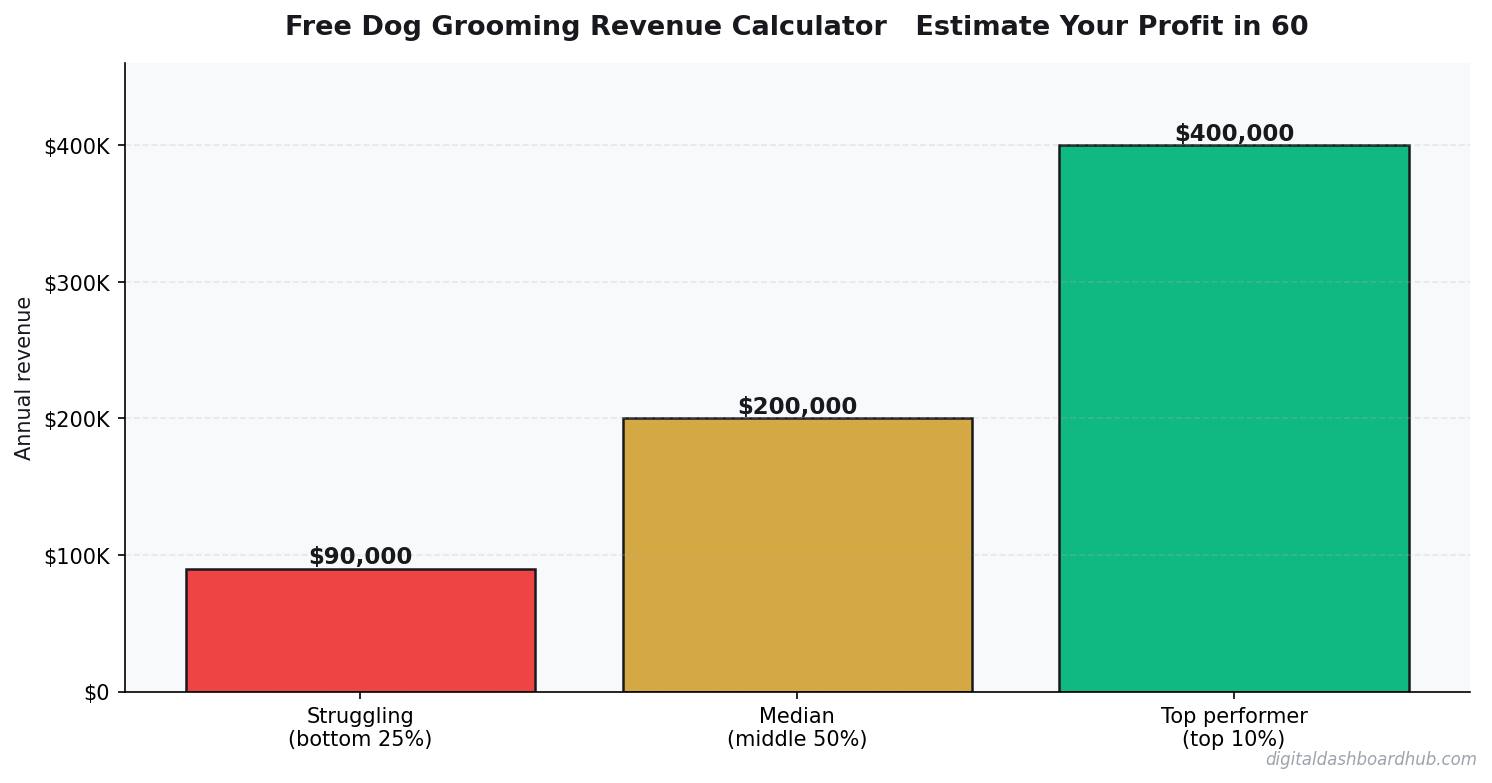
Dog Grooming Revenue: What the Numbers Actually Look Like
A mobile dog grooming operation — single van, owner-operator. Here’s what a productive month looks like with real math.
A mobile groomer can do 4-6 dogs per day in an 8-hour workday. At an average ticket of $75 (small to medium dogs; more for large breeds), that’s $300-$450/day. Five days per week, 4 weeks: $6,000-$9,000/month gross. After van costs ($800/month), insurance ($250/month), supplies ($400/month), and self-employment taxes, take-home runs $3,000-$5,000/month.
The economics are genuinely attractive for a one-person operation — low overhead, no rent, and a service that’s essentially recession-resistant. People’s dogs get groomed regardless of economic conditions.
The 3 Factors That Move Dog Grooming Revenue Most
Average ticket, not volume. Moving from $65 to $90 average ticket — through better pricing, premium add-ons (deshedding treatment, blueberry facial, teeth brushing), and targeting larger breeds — has the same revenue impact as booking 38% more dogs. Most groomers undercharge dramatically, especially for difficult or time-consuming breeds.
Route density. Dead drive time between appointments is dead revenue. A groomer staying within a 5-mile radius can do 6-7 dogs per day. One who travels 20 minutes between each does 4. Scheduling clients in the same neighborhood on the same day is worth $500-$1,000/month in recovered time.
Retention and booking frequency. A dog coming in every 6 weeks is worth 8.7 appointments per year. One coming in every 10 weeks is worth 5.2. Getting clients on a standing 6-week schedule with reminder texts and easy rebooking is the most profitable single system a groomer can build — and most don’t do it systematically.
The #1 Mistake: Not Raising Prices
Dog groomers are among the most reluctant service providers to raise prices, fearing client loss. In practice, a well-established groomer can raise prices 10-15% and lose fewer than 5% of clients — who are typically replaced within a month through word-of-mouth.
Run the calculator with your current numbers versus a 15% price increase. Then ask: is keeping prices flat actually serving your business, or is it just more comfortable?
Building a Route That Maximizes Dog Grooming Revenue Per Day
Dead drive time between appointments is dead revenue. A mobile groomer who travels 20-25 minutes between each appointment completes 4 dogs in an 8-hour day. One who stays within a tight geographic cluster completes 6-7. That difference — 2-3 additional dogs per day at $80-$120 each — represents $640-$1,440 per week, or $33,000-$75,000 per year in additional revenue from the same working hours.
Route efficiency improves dramatically with geographic clustering. Mondays: northwest quadrant. Tuesdays: downtown and adjacent neighborhoods. Wednesdays: eastern suburbs. The specific zones depend on where your clients live, but the principle is consistent — minimize cross-city transit by batching same-day appointments within a tight radius. Most mobile groomers who implement zone scheduling reduce average drive time between appointments from 18-22 minutes to under 8 minutes, recovering 40-60 minutes of productive capacity per day.
The scheduling constraint that limits most mobile groomers: appointments are booked whenever clients are available, without geographic consideration. A Monday with one appointment in the northwest, one in the southeast, and two downtown is a driving day, not a grooming day. The fix is setting day-specific geographic zones as a booking policy — “I’m in [neighborhood cluster] on Mondays and [different cluster] on Wednesdays.” Most regular clients accommodate this because they’re scheduling weeks in advance and care more about reliability than the specific day.
Route optimization translates directly into a standing appointment system. Clients who know their dog gets groomed the first Monday of every month in their geographic window become a predictable revenue stream that requires zero scheduling friction. A client on a 6-week standing appointment is worth 8.7 visits per year versus 5.2 visits for a client who books reactively every 10 weeks. The calculator’s retention section models this difference across your client base — the compound effect of moving 30% of your clients from reactive to standing booking is typically $8,000-$15,000 in annual revenue with no new clients required.
Keep reading (related guides):
- Auto Mechanic Revenue: What Owners Make vs. What Youd Expect (2026)
- Boutique Revenue Calculator
- Asana vs DDH Project Management: Team Collaboration
- Side Hustle Income Tax Tracker: The Free Dashboard That Keeps April From Destroying You
- Amazon FBA Revenue Calculator: What Sellers Actually Make in 2026
14-day trial · Stripe checkout · Cancel anytime
What Most People Get Wrong
The single biggest mistake is treating revenue as the headline number. Revenue is vanity — margin is sanity, and cash-in-bank is reality. Two operators with identical top-lines routinely end the year $80K apart in take-home, because one priced for volume and the other priced for sustainability. The calculator above forces you to surface that gap before it hits your bank account.
The second mistake is modeling a “best case” and planning around it. The number you should plan around is the 30th-percentile scenario — enough demand to matter, but slower than you hoped. If the business still covers your living expenses there, you have real margin of safety. If it only works in the 80th-percentile case, you are building on sand.
The third mistake is ignoring your time as a cost. If you would otherwise earn $55/hr at a day job and this operation pays you effectively $18/hr for 60-hour weeks, the gap is the real price of running it. Plug your opportunity cost into the calculator and the picture often flips.
How to Pressure-Test Your Numbers
Start with the calculator, then stress-test three levers independently:
- Pricing: What happens to your take-home if you raise prices 10%, but lose 15% of volume? Most operators are surprised to find net income goes up.
- Costs: What happens if your largest input cost rises 20%? This is not hypothetical — it is a typical 12-month swing in most industries.
- Volume: What happens at 70% of your planned volume for 90 days? If that still covers fixed costs, you have a real business. If not, the model is fragile.
Running the calculator three ways takes about ten minutes. The clarity on the other side of those ten minutes is usually the difference between a confident operating plan and guessing for another six months.
Frequently Asked Questions
How accurate is this calculator?
The underlying math uses industry-standard margin and cost ranges sourced from the Free Dog Grooming Revenue Calculator — Estimate Your Profit in 60 Seconds space. Your actual numbers depend on location, seasonality, and operating style, so treat this as a directional benchmark, not a guarantee. The more precisely you enter your inputs, the tighter the output range becomes.
Can I save my results?
A free Digital Dashboard Hub account saves every scenario you run, lets you compare side-by-side, and unlocks the full dashboard with expense tracking and month-over-month charts. The 14-day trial includes the complete tool library — no credit card required to start.
Who is this tool for?
It’s built for anyone pressure-testing a real decision — existing operators auditing their margins, side-hustlers deciding whether to go full-time, and prospective owners trying to sanity-check a business plan before signing a lease. You do not need any accounting background to use it.
What should I do with the results?
Start by comparing the output against your current (or projected) monthly take-home. If the gap is big, walk back the inputs and identify which lever — pricing, volume, or cost structure — is doing the damage. That is usually where the highest-leverage fix lives.
The Bottom Line
Most operators lose money not because the math is impossible, but because they never actually ran it. Fifteen minutes with the calculator beats three months of guessing. Run your numbers, screenshot the output, and use it as the baseline for every pricing and cost decision over the next quarter.
When you are ready to go deeper, the full Digital Dashboard Hub workspace lets you save scenarios, track actuals month-over-month, and see the trend before problems compound. That is the version that actually compounds the effort — spreadsheets forgotten in a Google Drive folder do not.
Next Steps
- Run the calculator above with your best current estimates.
- Re-run it with a pessimistic scenario (lower volume, higher costs) and a stretch scenario (better pricing, more efficient ops).
- Screenshot all three outputs so you have a baseline to compare against when reality arrives.
- Revisit monthly — the number that matters is the one that changes with your real P&L.
Ready for the full dashboard?
Unlock all 255 tools across business, creator, and health workflows.
Andy Gaber is the founder of Digital Dashboard Hub, a suite of 255+ interactive financial, productivity, and wellness tools. He built DDH after getting frustrated with financial apps that gave outputs without context. Follow along for tool tutorials, revenue analytics breakdowns, and honest takes on personal finance.