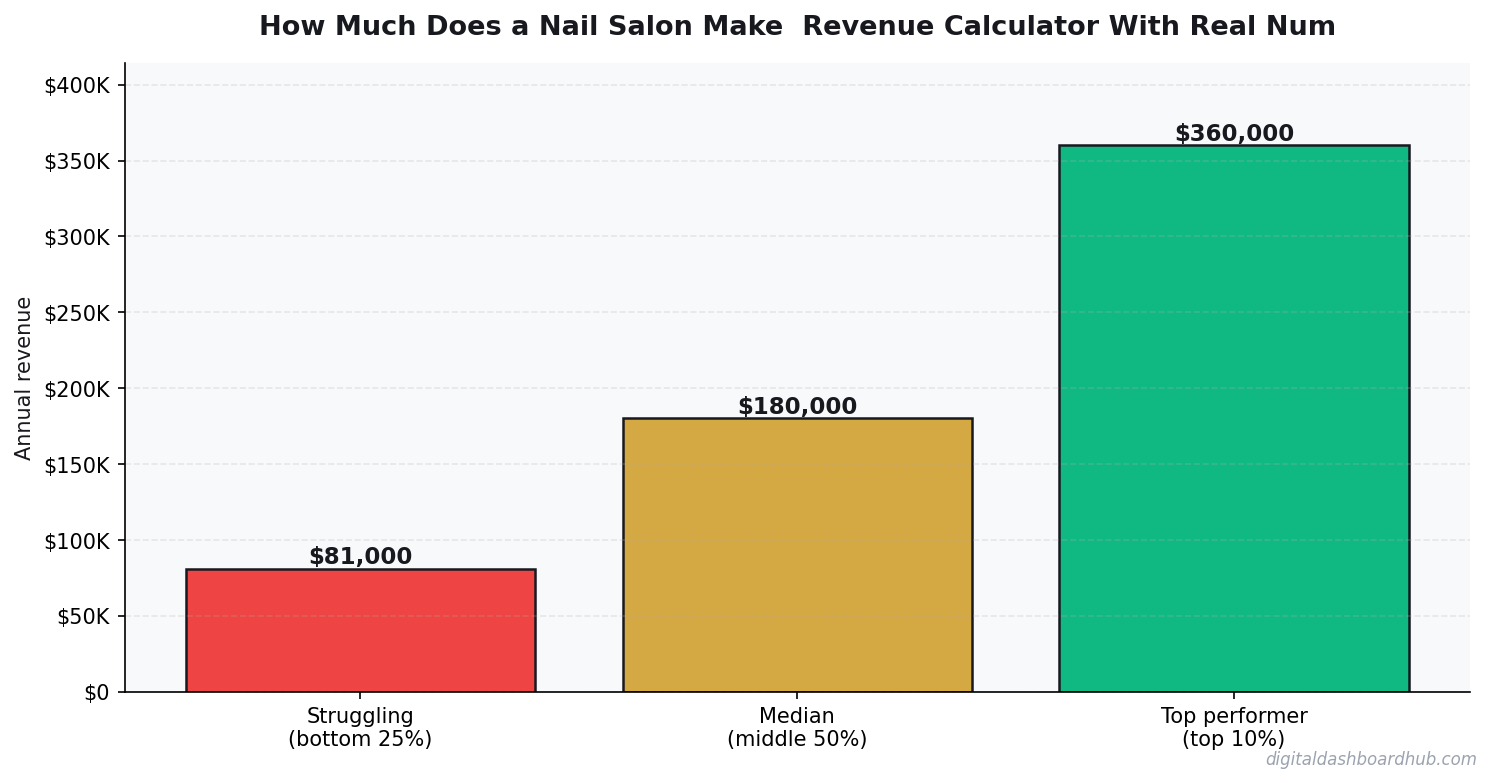
The average nail salon business generates $200,000-$400,000 in annual revenue, but owner take-home varies wildly based on location, pricing, and overhead management. I built a calculator that shows you the real numbers for your specific situation.
What Nail Salon Business Owners Actually Make in 2026
Enter your own numbers in the interactive tool below and get a real-time read. The dashboard version adds saved scenarios, history, and full feature access.
Let’s kill the generic income claims. Here are the numbers that matter for a nail salon business:
Those numbers mean nothing without context, though. A nail salon business in Austin has different rent than one in rural Ohio. Your pricing strategy, service mix, and client retention rate determine whether you land at the top or bottom of that range.
Why Your Pricing Strategy Makes or Breaks Your Nail Salon Business
Most nail salon business owners set prices by looking at what competitors charge and matching them. That’s a race to the middle that ignores your actual cost structure.
Here’s the math most people skip: if your overhead runs $6,000/month and you charge $35-$75 per service, you need a minimum client volume just to break even. Every dollar below that target is money you’re pulling from your own pocket.
The top-performing nail salon business businesses I’ve studied share three traits: they track revenue per service type, they know their cost per client acquisition, and they review their numbers monthly — not annually at tax time. If you’re interested in how other small business owners approach financial tracking, check out How Much Does a Hair Salon Make? (2026 Revenue Calculator).
The Real Cost Breakdown Nobody Shows You
Here’s what eats into nail salon business revenue, ranked by impact:
| Expense Category | % of Revenue | Monthly ($10K revenue) |
|---|---|---|
| Rent/Lease | 15-25% | $1,500-$2,500 |
| Labor/Staff | 25-40% | $2,500-$4,000 |
| Supplies/Materials | 8-15% | $800-$1,500 |
| Insurance | 3-6% | $300-$600 |
| Marketing | 3-8% | $300-$800 |
| Owner Take-Home | 15-25% | $2,500-$4,500 |
That table is why generic “how much does a nail salon business make” articles are useless. Your specific expense ratios determine whether you’re building wealth or subsidizing your own employment.
How the DDH Nail Salon Revenue Calculator Works
Here’s what running your numbers looks like in practice.
Step 1: Enter your service prices and average weekly client count. The calculator maps your gross revenue instantly — no formulas to build, no spreadsheet headaches.
Step 2: Plug in your actual overhead: rent, labor cost per hour, supply expenses, insurance. The tool calculates your true net margin and shows where the money goes.
Step 3: Run “what-if” scenarios. What if you raised prices by $10? Added a second employee? Moved to a cheaper location? Each scenario shows the revenue impact in real time.
The feature that made this worth building: the profit per service breakdown. Most nail salon business owners offer 5-10 different services but have no idea which ones are actually profitable. This shows you exactly which services earn you money and which ones you’re doing at a loss.
If you want to try this yourself: Open the Nail Salon Revenue Calculator free → — 14-day trial, no credit card, takes about 60 seconds to set up.
3 Ways to Push Your Nail Salon Business Revenue Higher
Raise prices strategically. A $5 increase on your most-booked service adds $100-$300/week with zero additional work. Most nail salon business owners haven’t raised prices in 2+ years despite rising costs. Related: Salon Owner Revenue Calculator: What Your Shop Can Actually Make.
Track utilization rate. If your chairs, rooms, or trucks sit empty 30% of the time, that’s recoverable revenue. Calculate your capacity utilization — the number should be above 75%.
Cut your worst expense ratio. Look at your biggest line item (usually rent or labor) and find one way to reduce it by 10%. For most businesses, that’s $200-$600/month straight to your bottom line.
DDH vs Other Nail Salon Business Revenue Tools
| Feature | Generic Spreadsheet | Industry Software | DDH Calculator |
|---|---|---|---|
| Industry-specific formulas | No | Yes | Yes |
| What-if scenarios | Manual only | Limited | Instant |
| Cost | Free (your time) | $30-$100/mo | Free trial |
| Setup time | 2-4 hours | 1-2 hours | 60 seconds |
| Profit per service | You build it | Some | Built-in |
Your Next Move
Right now (2 minutes): Write down your top 3 services and what you charge for each. If you can’t do this from memory, that’s your first problem.
This week: Pull your last 3 months of bank statements and calculate your actual overhead. Not what you think it is — what it really is.
The long play: Run your numbers through the DDH Nail Salon Revenue Calculator. It takes 60 seconds to set up, it’s free for 14 days, and you’ll walk away knowing exactly what your nail salon business needs to hit your income goal. There are 255+ tools in the platform — this is just one of them.
What a Nail Salon Actually Makes: A Real Example
A 3-station nail salon in a mid-tier suburban location, open 6 days/week with 2 full-time techs and 1 owner doing some client work:
Average ticket: $55 (mix of basic manis, gels, acrylics, and pedicures). Clients per station per day: 6. That’s 18 clients/day × $55 × 26 days = $25,740 gross monthly revenue.
Expenses: rent ($3,200), products and supplies ($2,800 at ~11% of revenue), two tech salaries ($6,400 combined), utilities/insurance ($900). Net before owner draw: $12,440. Owner takes a $5,000/month draw, leaving $7,440 in business profit. That’s a healthy salon — but it requires managing payroll, product costs, and retention simultaneously.
The Revenue Killers Most Nail Salons Ignore
No-shows without a deposit policy. A no-show on a 90-minute acrylic set is $75-$100 of lost revenue. Three per week is $300-$400/month evaporating. Card-on-file with a 48-hour cancellation policy is standard in salons doing $15K+ monthly — most still don’t have it, which is leaving real money uncaptured.
Product waste. Gel polish, acrylic powder, and builder gel go bad or get misused. Salons that do monthly product audits and enforce precise application protocols run 8-10% product cost ratios. Ones that don’t run 14-18%. On $25,000 in revenue, that’s a $1,000-$2,000 monthly difference — almost all profit.
The Move That Separates Average Nail Salons From Destination Salons
The nail industry has two tiers: commodity salons competing on price and proximity, and destination salons clients will drive 20+ minutes and pay a premium to visit. The separation happens on three fronts: quality of work (which requires ongoing training investment), ambiance (music, cleanliness, aesthetic — things that cost attention more than money), and the relationship between tech and client.
Destination salons train their techs to remember client details — their kid’s name, their job change, what nail style they were wearing last time. These aren’t tricks; they’re genuine hospitality habits. A client who feels recognized doesn’t comparison-shop. She pre-books, she tips well, and she sends her friends. The revenue difference between “fine” and “I love this place” is compounding and mostly free to create.
The Technology Upgrade That Pays for Itself in 60 Days
Online booking software with automated reminders (Vagaro, GlossGenius, Square Appointments) reduces no-shows by 30-40% and eliminates front desk phone time. For a 3-chair salon doing 540 appointments per month, a 35% reduction in no-shows recovers $1,000-$1,400 in monthly revenue. The software costs $50-$100/month. The math takes about 60 seconds. If your salon is still running on paper booking or verbal appointments, this is the first upgrade to make.
The Upgrade That Fills Your Slowest Hours
Most nail salons are slower Tuesday through Thursday mornings. A targeted promotion — “10% off appointments booked Tuesday to Thursday before noon” — fills those chairs without discounting peak weekend revenue. Targeted slow-period promotions are a standard practice in beauty businesses and convert meaningfully better than blanket discounts, which just train clients to wait for sales.
Keep reading (related guides):
- Bakery Revenue Calculator
- Barber Shop Revenue Calculator
- Pilates Studio Revenue Calculator: Class Pricing, Memberships, and Profit Margins
- YouTube Revenue Demystified: How Much YouTubers Actually Make (And How to Track Your Own)
- Small Business Finance Basics: The Only 5 Numbers You Need to Track Weekly
255+ interactive tools for your money, time, and health.
Full features for 14 days · Secure payment · Stop anytime
Build relationships with your nail product vendors. Most distributors will give you advance notice of price increases, access to early product launches, and occasional volume discounts if you are a consistent buyer. Those relationships translate directly to margin. The salons with the best product costs are almost always the ones where the owner knows their distributor rep by name and calls them quarterly. Small industry, long memories.
Keep Reading
- How Much Does a Hair Salon Make? (2026 Revenue Calculator)
- Salon Owner Revenue Calculator: What Your Shop Can Actually Make
- How to Start a Mobile Service Business in 2026: Revenue Calculator for 7 Niches
- Business Revenue Projection Calculator: Build a 12-Month Forecast
What Most People Get Wrong
The single biggest mistake is treating revenue as the headline number. Revenue is vanity — margin is sanity, and cash-in-bank is reality. Two operators with identical top-lines routinely end the year $80K apart in take-home, because one priced for volume and the other priced for sustainability. The calculator above forces you to surface that gap before it hits your bank account.
The second mistake is modeling a “best case” and planning around it. The number you should plan around is the 30th-percentile scenario — enough demand to matter, but slower than you hoped. If the business still covers your living expenses there, you have real margin of safety. If it only works in the 80th-percentile case, you are building on sand.
The third mistake is ignoring your time as a cost. If you would otherwise earn $55/hr at a day job and this operation pays you effectively $18/hr for 60-hour weeks, the gap is the real price of running it. Plug your opportunity cost into the calculator and the picture often flips.
How to Pressure-Test Your Numbers
Start with the calculator, then stress-test three levers independently:
- Pricing: What happens to your take-home if you raise prices 10%, but lose 15% of volume? Most operators are surprised to find net income goes up.
- Costs: What happens if your largest input cost rises 20%? This is not hypothetical — it is a typical 12-month swing in most industries.
- Volume: What happens at 70% of your planned volume for 90 days? If that still covers fixed costs, you have a real business. If not, the model is fragile.
Running the calculator three ways takes about ten minutes. The clarity on the other side of those ten minutes is usually the difference between a confident operating plan and guessing for another six months.
Frequently Asked Questions
How accurate is this calculator?
The underlying math uses industry-standard margin and cost ranges sourced from the How Much Does a Nail Salon Make? Revenue Calculator With Real Numbers space. Your actual numbers depend on location, seasonality, and operating style, so treat this as a directional benchmark, not a guarantee. The more precisely you enter your inputs, the tighter the output range becomes.
Can I save my results?
A free Digital Dashboard Hub account saves every scenario you run, lets you compare side-by-side, and unlocks the full dashboard with expense tracking and month-over-month charts. The 14-day trial includes the complete tool library — no credit card required to start.
Who is this tool for?
It’s built for anyone pressure-testing a real decision — existing operators auditing their margins, side-hustlers deciding whether to go full-time, and prospective owners trying to sanity-check a business plan before signing a lease. You do not need any accounting background to use it.
What should I do with the results?
Start by comparing the output against your current (or projected) monthly take-home. If the gap is big, walk back the inputs and identify which lever — pricing, volume, or cost structure — is doing the damage. That is usually where the highest-leverage fix lives.
The Bottom Line
Most operators lose money not because the math is impossible, but because they never actually ran it. Fifteen minutes with the calculator beats three months of guessing. Run your numbers, screenshot the output, and use it as the baseline for every pricing and cost decision over the next quarter.
When you are ready to go deeper, the full Digital Dashboard Hub workspace lets you save scenarios, track actuals month-over-month, and see the trend before problems compound. That is the version that actually compounds the effort — spreadsheets forgotten in a Google Drive folder do not.
Next Steps
- Run the calculator above with your best current estimates.
- Re-run it with a pessimistic scenario (lower volume, higher costs) and a stretch scenario (better pricing, more efficient ops).
- Screenshot all three outputs so you have a baseline to compare against when reality arrives.
- Revisit monthly — the number that matters is the one that changes with your real P&L.
Ready for the full dashboard?
Unlock all 255 tools across business, creator, and health workflows.
Andy Gaber is the founder of Digital Dashboard Hub, a suite of 255+ interactive financial, productivity, and wellness tools. He built DDH after getting frustrated with financial apps that gave outputs without context. Follow along for tool tutorials, revenue analytics breakdowns, and honest takes on personal finance.