Target Keywords: rental property calculator, real estate investment spreadsheet, rental income tracker
About this article: I’m Andy, founder of Digital Dashboard Hub. I built DDH’s 255 free interactive tools to solve the specific financial, productivity, and wellness tracking gaps I kept seeing — starting with the problem this article covers. The free tool below is available without signup and works instantly. Try it and see your numbers in real time.
Introduction: The Reality Check Your Real Estate Dreams Need
The dashboard below loads instantly in your browser. Plug in your numbers, see your answer. No signup to try the basics.
Rental property investment sounds simple on the surface: buy a house, rent it out, watch the money flow in. But behind every successful rental investment is someone who actually ran the numbers first. And behind every rental disaster is someone who didn’t.
The difference between a profitable rental property and a cash-draining nightmare often comes down to one thing: analysis. Not luck. Not market timing. Analysis.
This guide walks you through exactly how to evaluate a rental property deal before you sign anything. We’ll cover the metrics professional investors use, the hidden costs that derail beginners, and most importantly—how to know when NOT to invest. By the end, you’ll understand whether a specific property makes financial sense for your situation.
Disclaimer: This article is educational only and does not constitute financial, tax, or investment advice. Consult with a qualified financial advisor, tax professional, and real estate attorney before making any investment decisions. Real estate markets vary by location, and past performance doesn’t guarantee future results.
Understanding the Core Metrics: What Professional Investors Actually Look At
Cap Rate (Capitalization Rate)
The cap rate is the annual return on your cash investment, assuming you bought the property with all cash and had no mortgage.
Formula: Cap Rate = Net Operating Income (NOI) / Property Purchase Price
Example: If a property costs $300,000 and generates $15,000 in annual NOI, the cap rate is 5% ($15,000 / $300,000).
A higher cap rate generally means better returns, but context matters. In expensive markets like San Francisco or New York, 4-5% cap rates are normal. In secondary markets like Memphis or Indianapolis, 7-10% is more typical. Don’t compare cap rates across different markets without understanding local conditions.
Most investors look for cap rates between 5-10%, depending on their risk tolerance and market location. Anything below 3-4% suggests you’re paying a premium for appreciation, not cash flow.
Cash-on-Cash Return
This is the annual profit compared to the actual cash you put down (your down payment, not the full purchase price).
Formula: Cash-on-Cash Return = Annual Cash Flow / Total Cash Invested
Example: You put down $60,000 (20% down on a $300,000 property). The property generates $8,000 in annual cash flow after the mortgage. Your cash-on-cash return is 13.3% ($8,000 / $60,000).
This metric matters more to real investors than cap rate because it shows what you actually earned on the money you actually spent. Most investors target 8-12% cash-on-cash returns, though this varies by market and strategy.
Net Operating Income (NOI)
This is the property’s annual profit before paying the mortgage, capital gains taxes, or anything else.
Formula: NOI = Gross Rental Income – Operating Expenses
This includes rent collected minus property taxes, insurance, maintenance, property management, vacancy loss, and utilities (if you pay them). It does NOT include the mortgage payment, capital improvements, or income taxes.
Example: A duplex rents for $2,000/month per unit ($4,000/month total). Annual gross income is $48,000. Operating expenses total $14,000/year. NOI = $34,000.
Understanding NOI is critical because it reveals the property’s intrinsic earning power independent of how you financed it.
How to Analyze a Rental Property Deal: Step-by-Step
Step 1: Determine Realistic Rental Income
Don’t use the rent your realtor says “could be charged.” Research actual market rents using:
- Zillow and Apartments.com rental listings in the neighborhood
- Local property management company market reports
- Recent rent history for comparable units
Be conservative. If comparable units rent for $1,400-$1,600, assume $1,400 for your analysis. If a unit sits vacant for one month per year, that’s your vacancy assumption.
Pro tip: Track potential rental income in a spreadsheet so you can compare multiple properties. Our Rental Property Analysis Worksheet at the bottom of this article gives you the exact format.
Step 2: List Every Operating Expense (Honestly)
This is where most beginner investors go wrong. They underestimate costs. Don’t.
Property taxes: Check the property record with your local tax assessor. These are public.
Insurance: Get actual quotes from insurance agents. Don’t guess.
Maintenance and repairs: Plan for 1% of property value annually as a baseline. Older properties need 2-3%.
Vacancy: Assume 5-10% of potential rental income stays uncollected.
Property management: If you hire a manager, expect 8-12% of collected rent.
Utilities (only if you pay them)
Trash, water, sewer (if not included in rent)
Step 3: Calculate Net Operating Income
Subtract all operating expenses from gross rental income. This is your NOI—the true earning power of the property.
Step 4: Run Cap Rate and Cash-on-Cash Numbers
Using your down payment and mortgage terms:
- Calculate your annual mortgage payment
- Subtract mortgage from NOI to get actual cash flow
- Divide by your cash down payment for cash-on-cash return
- Divide NOI by purchase price for cap rate
If these numbers don’t meet your minimum targets (typically 8-12% cash-on-cash), the deal probably isn’t worth pursuing.
Step 5: Stress-Test Your Assumptions
What if vacancy is 12% instead of 8%? What if a major repair hits in year two? What if interest rates jump and you want to refinance? Run these scenarios so you’re not blindsided by surprises.
The Hidden Costs That Destroy Rental Investments
Vacancy Losses (Often Underestimated)
Many new investors assume their property will be rented 12 months/year. Reality: there’s typically 1-2 months of vacancy annually, plus time for turnover.
Budget 5-10% of gross rent for vacancy, depending on market demand.
Maintenance and Repairs (Higher Than You Think)
That 1% rule? It’s a minimum. Older properties, particularly those 30+ years old, often need 2-3% annually. In one year it might be the roof. Next year, the HVAC system.
Keep a maintenance reserve account separate from your operating account.
Tenant Turnover Costs
New carpet, paint, cleaning, repairs between tenants, lost rent during turnover—budget $1,000-$3,000 per turnover. If your property turns every 3 years on average, that’s $350-$1,000 annually.
Property Management Fees
Self-managing seems free, but your time has value. Professional property managers typically charge 8-12% of collected rent plus a turnover fee ($200-$500 when a tenant leaves). This actually improves property performance because managers negotiate better insurance rates, respond faster to maintenance issues, and screen tenants more carefully.
Capital Expenditures (CapEx)
Roofs, HVAC systems, plumbing, electrical—these aren’t regular maintenance. They’re big expenses. Budget $50-100 monthly per unit for future replacements.
Insurance and Tax Surprises
Property taxes can increase 3-5% annually. Insurance can jump due to market conditions or claim history. Get quotes and projections, not assumptions.
Local Taxes and Licensing
Some cities require rental licenses ($50-500 annually). Some areas tax rental income differently. Verify your jurisdiction.
When NOT to Invest: Red Flags Every Investor Should Know
You Don’t Have an Emergency Fund
If you’re thinly capitalized and a $5,000 plumbing issue would stress you out, don’t buy rental property. Invest in your emergency fund first.
The Property Can’t Sustain 8%+ Cash-on-Cash Return
If your math shows only 4-5% cash flow, you’re betting everything on appreciation. That’s not investing; that’s speculation.
You’re Buying in a One-Industry Town
If the entire local economy depends on one major employer or industry, economic disruption could crater rents overnight. Diversify geographically.
The Property Needs Immediate Major Repairs
Don’t count on getting repairs done cheaper after closing. Factor full replacement costs into your analysis.
You Don’t Have Time or Interest in Property Management
Landlording is not passive income if you’re hands-on. If you don’t want to be a landlord, that’s fine—but be honest about it. Property management fees eat into returns.
The Seller Is Desperate (Sometimes)
A desperate seller might mean the property has serious hidden issues. Get inspections. Always.
Local Market is in a Speculative Bubble
In 2022-2023, many markets saw speculative buying. Properties were priced for appreciation, not cash flow. When the market corrects, these investors suffer. Buy based on current cash flow, not hoped-for appreciation.
Tools to Make Analysis Easier
Running these calculations manually is tedious and error-prone. Smart investors use spreadsheets or dedicated tools to compare properties quickly and consistently.
The VVS Fix and Flip Profit Calculator helps you model renovation-based returns. The Rent vs. Buy Decision Calculator lets you compare renting versus buying financially over a 30-year period.
For rental income tracking, the Short Term Rental Profit Calculator works for traditional rentals too—simply adjust the occupancy and rates for annual leases instead of nightly rates.
Many serious investors also maintain a Net Worth Tracker Dashboard to monitor the overall impact of real estate on their financial picture.
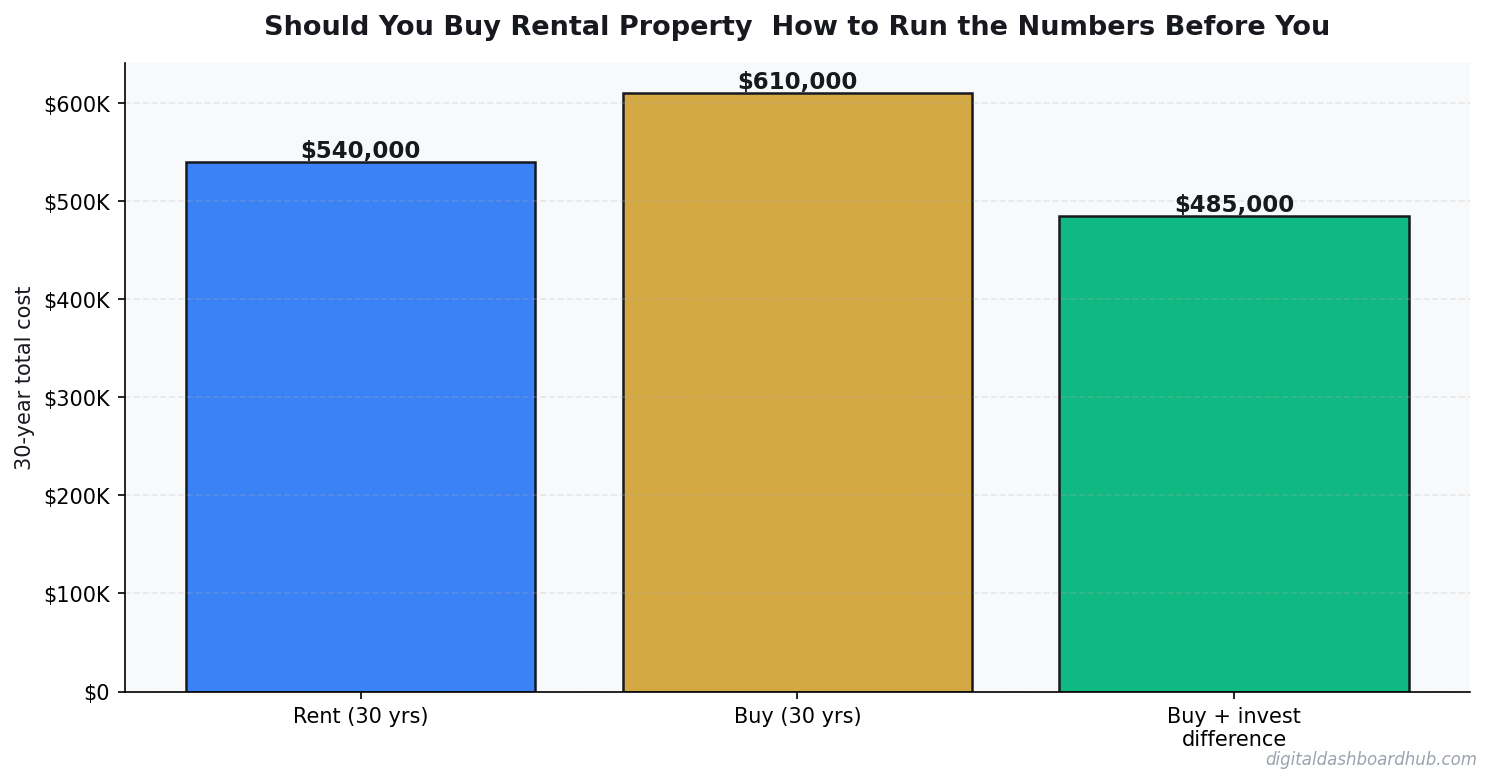
Real Example: Running the Numbers
Let’s walk through a realistic scenario.
Property: 3-bedroom, 1-bath single-family home
Purchase Price: $250,000
Down Payment: $50,000 (20%)
Mortgage: $200,000 at 7% interest over 30 years = $1,330/month
Rental Market: $1,650/month
| Item | Amount |
|---|---|
| Gross Monthly Rent | $1,650 |
| Annual Gross Income | $19,800 |
| Operating Expenses: | |
| Property Taxes (estimated) | $2,400 |
| Insurance | $900 |
| Maintenance Reserve (1%) | $2,500 |
| Vacancy (5%) | $990 |
| Property Management (10%) | $1,980 |
| Total Operating Expenses | $8,770 |
| NOI | $11,030 |
| Mortgage (annually) | $15,960 |
| Annual Cash Flow | -$4,930 |
| Cash-on-Cash Return | -9.9% |
| Cap Rate | 4.4% |
Verdict: This deal loses money every month. You’d be paying out of pocket to maintain it. Unless you’re expecting significant appreciation or have a multi-year tax strategy, this isn’t a sound investment by cash-flow standards.
Getting Started: Your Next Steps
Step 1: Get clear on your investment criteria. What cash-on-cash return do you need? What cap rate is acceptable in your target market?
Step 2: Download our free Rental Property Analysis Worksheet (below) and bookmark it. Use it for every property you evaluate.
Step 3: Find a reliable local property manager and get a market report. Understanding your market’s realistic rents and expenses is foundational.
Step 4: Connect with local real estate investors through meetups or online communities. Their market insights are invaluable.
Step 5: Don’t rush. A good deal will still be good next month. A bad deal now will be a nightmare for years.
Free Resource: Download Our Rental Property Analysis Worksheet
Stop evaluating properties in your head. Use a structured system.
Our free Rental Property Analysis Worksheet includes:
- Pre-built cap rate and cash-on-cash calculators
- Operating expense checklist (nothing forgotten)
- Mortgage calculator
- Side-by-side comparison for multiple properties
- Stress-testing scenarios
- Print-friendly format
⬇️ Download Your Free Worksheet ⬇️
Recommended VVS Tools for Real Estate Investors
Once you own rental properties, managing them means tracking multiple income and expense streams. These VVS tools help:
- Rent vs. Buy Decision Calculator — Evaluate whether buying makes financial sense versus renting in your market
- Short Term Rental Profit Calculator — Adaptable for annual rental tracking and seasonal variations
- Net Worth Tracker Dashboard — See your full financial picture including real estate equity growth
- Property Tax Estimator — Project tax increases and understand tax appeal potential
Final Thoughts
Rental property investment can be incredibly rewarding—but only if you analyze deals properly before committing. The investors making consistent returns aren’t the ones buying on emotion or hunches. They’re the ones with spreadsheets, honest numbers, and the discipline to walk away from bad deals.
You now have the framework. Use it. Run the numbers. Compare properties objectively. And remember: a property that loses money is a liability, not an investment, regardless of how good it looks.
Start with one solid deal where the math works before you scale. That’s how successful rental portfolios actually get built.
Important Disclaimer
This article is educational in nature and does not constitute financial advice, investment advice, tax advice, or legal advice. Real estate investment involves risk, including potential loss of principal. Market conditions, local regulations, and individual circumstances vary widely.
Before purchasing any rental property, consult with:
- A qualified financial advisor who understands your complete financial situation
- A tax professional regarding depreciation, deductions, and tax implications
- A real estate attorney regarding contracts, liability, and local landlord laws
- A professional property inspector regarding the physical condition of any property
Past investment performance does not guarantee future results. Rental income, expenses, and property values fluctuate. The examples in this article are illustrative only and may not reflect your specific market conditions. Always verify current market data, interest rates, tax laws, and insurance costs for your specific location.
About Vault & Vessel Studio: VVS creates practical financial planning tools and calculators for everyday investors, entrepreneurs, and families building wealth. Our spreadsheets are designed to remove guesswork from financial decisions—one calculation at a time.
Keep reading (related guides):
- Never Work Again Calculator: The Exact Number by Age
- How Much Money You Need to Retire Early at 40, 45, and 50 (Real Numbers by Age)
- The Exact Number You Need to Never Work Again — By Age (How to Calculate It)
- Jira vs DDH Task Tracker: Project Management for Small Teams
- How Journaling Rewires an Anxious Brain: A Science-Backed Guide
255+ interactive tools for your money, time, and health.
Full dashboard access · Stripe-secure checkout · Cancel anytime
Keep Reading
- I Tested 9 Expense Tracker Apps for 3 Months — Here’s What Actually Worked
- Freelancer Finance Management Dashboard (VVS): Finally, a Money Tool Built for Variable Income
- Airbnb Revenue Calculator: Estimate Your Short-Term Rental Income Before You List
Andy Gaber is the founder of Digital Dashboard Hub, a suite of 255+ interactive financial, productivity, and wellness tools. He built DDH after getting frustrated with financial apps that gave outputs without context. Follow along for tool tutorials, revenue analytics breakdowns, and honest takes on personal finance.