Use the free Auto Mechanic Revenue Calculator below — plug in your real numbers and get instant results. No signup required for the lite version.
Try the Auto Mechanic Revenue Calculator
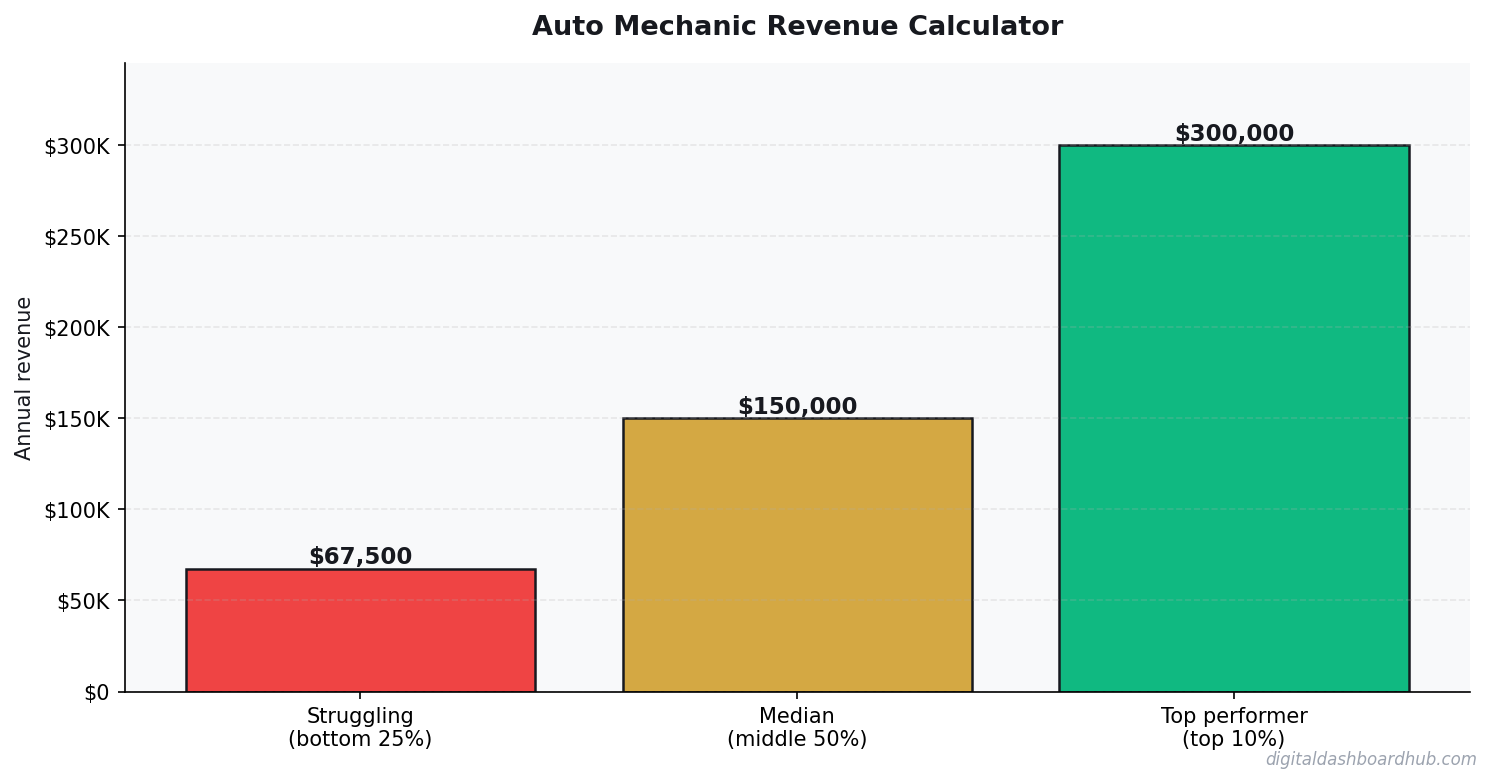
Auto Mechanic Revenue Calculator
Enter your numbers below — results update instantly
Want the full Auto Mechanic dashboard with expense tracking, break-even analysis, and growth projections?
Why This Matters
Running numbers in your head is how bad financial decisions happen. A quick calculation with real data beats a gut feeling every single time. I built this tool because I was tired of spreadsheet gymnastics just to answer basic questions about my finances.
The calculator above handles the basics. But if you need trend tracking, scenario comparison, and exportable reports — the full version inside Digital Dashboard Hub does all of that and more.
What You Get in the Full Dashboard
| Approach | Startup Cost | Time Investment | Revenue Potential | Best For |
|---|---|---|---|---|
| Solo operator | Low ($1K-$10K) | Full time | $60K-$200K/yr | Maximum margins, full control |
| Small team (2-5) | Medium ($10K-$50K) | Management + some fieldwork | $200K-$800K/yr | Scaling without losing control |
| DDH Revenue Tracker | Free trial | 5 min setup | N/A (profit tool) | Know your real numbers in real time |
The full Auto Mechanic Revenue Calculator inside DDH includes features the lite version above can’t offer:
- Historical tracking — see your numbers change over weeks and months
- Visual charts — bar graphs, trend lines, and breakdowns that make patterns obvious
- Scenario modeling — “what if I change X?” comparisons side by side
- PDF reports — export professional reports for partners, lenders, or your own records
- — one subscription covers every calculator and tracker in the library
How to Use This Tool
Step 1: Enter your actual numbers in the fields above. Don’t guess — pull from your bank statements or business records for the most accurate results.
Step 2: Read the output cards. They update instantly as you type. Play with different scenarios to see how small changes affect your bottom line.
Step 3: If you want to save your results, track changes over time, or run more advanced projections — start a free 14-day trial of the full dashboard. No credit card required.
Your Next Move
You’ve already done the hardest part — you looked at your numbers instead of avoiding them. Here’s what to do with that momentum:
- Right now (30 seconds): Bookmark this page so you can rerun the calculation next month
- This week: Pull your real numbers from your accounts and run them through the calculator above
- Long game: Try the full DDH dashboard — 261 tools, 14 days free, cancel anytime
More Below
- Side Hustle Income & Tax Tracker: The Free Dashboard That Keeps April From Destroying You
- The Complete Guide to Building Habits That Actually Stick (Using a Digital Habit Tracker)
- The True Cost of a Mortgage vs. The True Cost of Renting: A 30-Year Analysis
Common Questions About Auto Mechanic Revenue Calculator
How long does it take to see results?
Most people see meaningful progress within 30-90 days when they apply these strategies consistently. The key is tracking your numbers from day one so you have a baseline to measure against.
What’s the biggest mistake people make?
Trying to do everything at once. Pick one or two strategies from this guide, implement them fully, then layer in additional tactics. Spreading yourself thin is the fastest way to see no results from any of it.
Do I need special tools or software?
Not necessarily to start — but the right tools eliminate hours of manual work. Our free calculators and trackers at Digital Dashboard Hub are a good starting point before you invest in paid software.
What an Auto Repair Shop Actually Nets — Real Numbers
A three-bay independent shop in a suburban market, two technicians plus owner-operator.
Monthly gross: $42,000. Breakdown: 2 techs × 160 billed hours × $110 shop rate = $35,200 labor revenue. Parts revenue at 40-50% markup on cost: ~$6,800. Total: $42,000.
Costs: Parts cost at 55% of parts revenue: $3,740. Technician wages (2 × $28/hr × 160 hrs): $8,960. Rent: $3,800. Insurance: $520. Tooling and software: $680. Utilities: $420. Marketing: $300. Total: $18,420. Net operating profit: ~$23,580/month — the owner takes wages for their own labor from this, with remaining as business profit.
The 3 Factors That Move Auto Shop Revenue Most
1. Effective labor rate. A $110 door rate means nothing at 65% efficiency. Shops hitting 90% efficiency earn $15,840/month per tech vs. $11,440 at 65%. That’s $8,800/month difference per technician from process improvement alone.
2. Deferred maintenance conversion. The average vehicle inspection reveals $800-1,200 in recommended services beyond the presenting complaint. Shops with systematic vehicle health reports and advisors trained to present them professionally convert 40-50% of these opportunities. Shops that don’t mention it leave that revenue on the table entirely.
3. Fleet accounts. One small business with 8-12 vehicles servicing regularly can be worth $30,000-50,000/year in predictable work. Three good fleet accounts change a struggling shop’s cash flow from reactive to stable. Fleet clients are less price-sensitive and more loyal than individual consumers.
Where Auto Mechanic Shops Make (and Lose) Their Money
Auto repair shops live and die on labor efficiency. A shop charging $125/hour needs to bill that rate on actual wrench time, not clock time. Most shops target 80–85% billable efficiency — meaning for every technician hour on the clock, they want at least 48–51 minutes of billed labor. A shop running at 60% efficiency is effectively charging customers $75/hour instead of $125, even though the tech is being paid for all 8 hours.
Parts margins are the other revenue lever. Most independent shops mark up parts 40–60% over cost. On a $600 in parts job, that’s $240–$360 in gross margin from parts alone, separate from labor. Shops that allow customers to bring their own parts lose this margin — which is why most shops won’t allow it, or charge a significant labor premium if they do.
The jobs that hurt margin are the diagnostic nightmares: intermittent issues, electrical gremlins, cars with deferred maintenance that cascade into multi-system failures. A 3-hour diagnostic that leads to a declined estimate is revenue the shop collected at $0/hour. Charging diagnostic fees — and being transparent about them upfront — is standard practice in profitable shops but still resisted by many owners who fear losing the customer.
Building a Shop That Generates Reliable Income Year Over Year
The most stable auto repair shops are the ones with a strong base of fleet accounts. A landscaping company, delivery service, or taxi fleet sending 5–15 vehicles per month generates $8,000–$25,000 in recurring revenue with almost zero sales effort after the initial relationship is built. Fleet work is typically less lucrative per job than retail, but the volume and predictability make it worth taking at a slight margin discount.
Maintenance packages are another retention tool that improves cash flow. A $299 annual maintenance plan covering oil changes, tire rotations, and a multi-point inspection gets customers back in the door on schedule — and each visit is an opportunity to identify and estimate deferred repairs. Shops with strong maintenance program enrollment have higher per-customer lifetime value and more predictable month-to-month revenue.
Staff retention is the single most important factor for a shop’s long-term profitability. Losing a master tech means losing $80,000–$120,000 in annual billing capacity while you search for a replacement, plus the cost of re-establishing that tech’s regular customers with someone new. Paying slightly above market, sharing in shop profitability, and creating clear advancement paths costs less than the revolving door alternative.
SaaS Metrics That Predict Revenue 90 Days Out
Most SaaS founders track lagging indicators — revenue, churn, MRR growth — and react after the damage is done. These three leading indicators give you a 60–90 day warning window:
Trial activation rate. The percentage of trials that complete your core onboarding action (not just sign up — actually use the product) predicts paid conversion rate almost perfectly. If activation drops 5 points, expect paid conversions to drop 2–3 points 30 days later. Fix activation before you spend more on acquisition.
Feature adoption breadth. Customers using 3+ features churn at roughly half the rate of customers using 1 feature. If new signups aren’t adopting secondary features within the first 14 days, your onboarding is creating single-feature customers who are one bad experience away from canceling.
Support ticket volume per customer. A rising ticket rate signals product confusion, which precedes churn by 4–6 weeks. Track it per cohort — if a specific month’s cohort is generating more tickets, something in that period’s onboarding or feature release broke the experience.
Keep reading (related guides):
Instant signup · Stripe-secure · Cancel in one click
Andy Gaber is the founder of Digital Dashboard Hub, a suite of 255+ interactive financial, productivity, and wellness tools. He built DDH after getting frustrated with financial apps that gave outputs without context. Follow along for tool tutorials, revenue analytics breakdowns, and honest takes on personal finance.