Use the free Brewery Revenue Calculator below — plug in your real numbers and get instant results. No signup required for the lite version.
Brewery revenue depends on tap count, pour pricing, and how many seats you’re turning per night — and most owners are guessing. This calculator takes your real numbers and shows you a monthly revenue projection you can actually plan around.
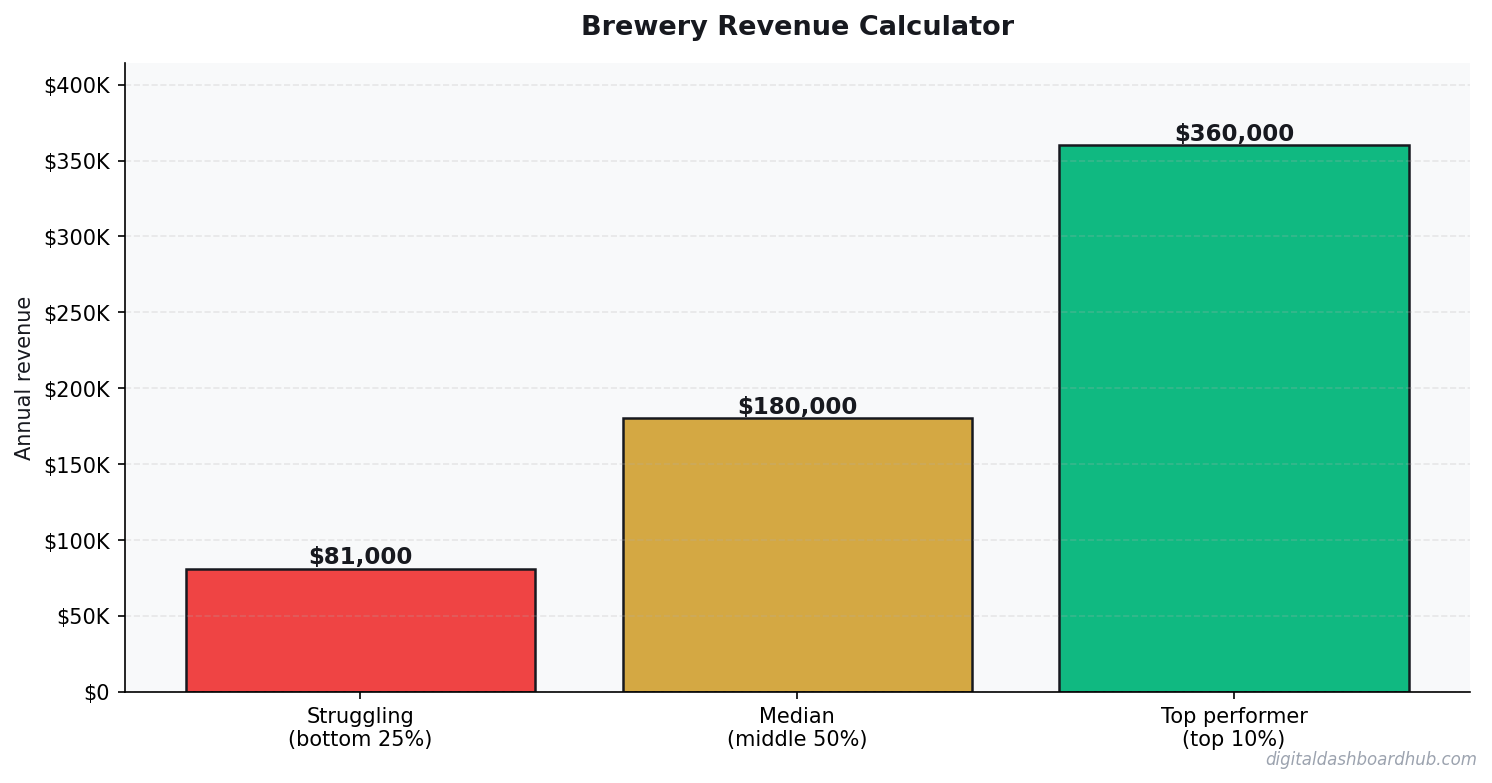
How Much Revenue Can a Craft Brewery Actually Generate?
Enter your own numbers in the interactive tool below and get a real-time read. The dashboard version adds saved scenarios, history, and full feature access.
Brewery Revenue Calculator
Enter your numbers below — results update instantly
Want the full Brewery dashboard with expense tracking, break-even analysis, and growth projections?
Why This Matters
Running numbers in your head is how bad financial decisions happen. A quick calculation with real data beats a gut feeling every single time. I built this tool because I was tired of spreadsheet gymnastics just to answer basic questions about my finances.
The calculator above handles the basics. But if you need trend tracking, scenario comparison, and exportable reports — the full version inside Digital Dashboard Hub does all of that and more.
What You Get in the Full Dashboard
| Approach | Startup Cost | Time Investment | Revenue Potential | Best For |
|---|---|---|---|---|
| Solo operator | Low ($1K-$10K) | Full time | $60K-$200K/yr | Maximum margins, full control |
| Small team (2-5) | Medium ($10K-$50K) | Management + some fieldwork | $200K-$800K/yr | Scaling without losing control |
| DDH Revenue Tracker | Free trial | 5 min setup | N/A (profit tool) | Know your real numbers in real time |
The full Brewery Revenue Calculator inside DDH includes features the lite version above can’t offer:
- Historical tracking — see your numbers change over weeks and months
- Visual charts — bar graphs, trend lines, and breakdowns that make patterns obvious
- Scenario modeling — “what if I change X?” comparisons side by side
- PDF reports — export professional reports for partners, lenders, or your own records
- — one subscription covers every calculator and tracker in the library
How to Use This Tool
Step 1: Enter your actual numbers in the fields above. Don’t guess — pull from your bank statements or business records for the most accurate results.
Step 2: Read the output cards. They update instantly as you type. Play with different scenarios to see how small changes affect your bottom line.
Step 3: If you want to save your results, track changes over time, or run more advanced projections — start a free 14-day trial of the full dashboard. No credit card required.
Your Next Move
You’ve already done the hardest part — you looked at your numbers instead of avoiding them. Here’s what to do with that momentum:
- Right now (30 seconds): Bookmark this page so you can rerun the calculation next month
- This week: Pull your real numbers from your accounts and run them through the calculator above
- Long game: Try the full DDH dashboard — 261 tools, 14 days free, cancel anytime
Continue Reading
- Why Traditional Budgets Fail ADHD Brains — And the Visual Tracker That Actually Works
- You’re Probably Wasting $200/Month on Subscriptions You Forgot About (Here’s How to Find Them)
- Freelancer Finance Dashboard: Track Income, Taxes, and Cash Flow in One Visual Hub
Common Questions About Brewery Revenue Calculator
How long does it take to see results?
Most people see meaningful progress within 30-90 days when they apply these strategies consistently. The key is tracking your numbers from day one so you have a baseline to measure against.
What’s the biggest mistake people make?
Trying to do everything at once. Pick one or two strategies from this guide, implement them fully, then layer in additional tactics. Spreading yourself thin is the fastest way to see no results from any of it.
Do I need special tools or software?
Not necessarily to start — but the right tools eliminate hours of manual work. Our free calculators and trackers at Digital Dashboard Hub are a good starting point before you invest in paid software.
What a Small Brewery Actually Makes — Real Numbers
A 7-barrel brewpub in a mid-size city. Real financials rather than the optimistic pitch.
Taproom: 350 pint-equivalents/week at $7.50 average. Monthly taproom gross: $11,340. Food (pub fare): $3,400/month. Growler fills: $1,200/month. Packaged beer: $2,800/month. Monthly gross: ~$18,740.
Costs: Ingredients at $1.20/gallon: $1,800/month. Labor (2 FT + part-time taps): $9,200. Rent and utilities: $5,400. Equipment maintenance and packaging: $1,100. Total: $17,500. Net: ~$1,240/month — which is why most small breweries embed owner compensation in the labor line.
The 3 Factors That Move Brewery Revenue Most
1. Taproom vs. wholesale mix. Direct taproom sales carry 60-75% gross margins. Wholesale carries 35-50% after distributor cut. Smart small breweries maximize taproom and treat wholesale as secondary — the economics are dramatically better when you control the pour.
2. Events and private bookings. A brewery hosting 3-4 private events/month at $1,500-2,500 each adds $4,500-10,000/month in high-margin revenue. Event revenue is the most profitable line in a small brewery’s P&L. Beer is pre-sold, staff costs are predictable, and there’s no food waste.
3. Beer-to-food ratio. Food dramatically increases per-head spend and dwell time, but at much lower margins and significant operational complexity. Food-lite operations — shareable plates, no full kitchen — outperform full-service models at small brewery scale. The best operations I’ve seen keep food revenue under 25% of total and run kitchen staff lean.
How Craft Brewery Revenue Actually Gets Made (and Lost)
Craft brewing looks like a product business but runs like a hospitality business. The highest-margin revenue for most small breweries isn’t the beer in the can — it’s the pint poured in the taproom. On-premise draft beer at $7–$9/pint has a product cost of $0.80–$1.40. That’s an 80–85% gross margin. A small taproom doing 50 pints/day, 6 days/week generates $1,680–$2,160/week at 30% revenue cost. Distribution margins are a fraction of that.
The economics of distribution are brutal for small breweries. After paying the distributor margin (25–35%), retailer markup, and state licensing fees, a brewery might net $0.80–$1.20 per six-pack on product that took 4 weeks to make. You need serious volume to make distribution profitable, and that volume requires production capacity most small breweries don’t have without significant capital investment.
Events and experiences are the third revenue leg that changes the model. A brewery hosting a private event at $2,500–$8,000 minimum spend is collecting high-margin revenue with the same staff and space already on payroll. Trivia nights, food truck pairings, and beer releases that drive taproom foot traffic cost almost nothing to produce relative to the revenue they generate.
The Real Costs of Starting and Running a Brewery
Capital requirements for a legitimate craft brewery are higher than most aspiring owners expect. A 7-barrel system with fermentation capacity, taproom buildout, licensing, and 6 months of working capital is realistically $500,000–$1,000,000. The variance is wide depending on whether you’re building from scratch, taking over an existing space, or starting as a nano-brewery in a shared facility. The nano route ($50,000–$150,000) is the only path most first-time operators can actually fund.
TTB (federal) and state licensing alone can take 4–8 months and $5,000–$15,000 in fees and legal costs. During that period you’re paying rent and potentially staff without a single dollar of revenue. Operators who underestimate this timeline typically run out of runway before their first pour.
Ongoing COGS for craft beer run 25–40% of revenue depending on ingredient costs, batch size, and efficiency. Raw ingredient prices have spiked significantly — hops are up 30–40% over the past 3 years. Breweries without locked-in hop contracts at favorable pricing are absorbing margin pressure that smaller operations can’t easily pass to customers through price increases.
SaaS Metrics That Predict Revenue 90 Days Out
Most SaaS founders track lagging indicators — revenue, churn, MRR growth — and react after the damage is done. These three leading indicators give you a 60–90 day warning window:
Trial activation rate. The percentage of trials that complete your core onboarding action (not just sign up — actually use the product) predicts paid conversion rate almost perfectly. If activation drops 5 points, expect paid conversions to drop 2–3 points 30 days later. Fix activation before you spend more on acquisition.
Feature adoption breadth. Customers using 3+ features churn at roughly half the rate of customers using 1 feature. If new signups aren’t adopting secondary features within the first 14 days, your onboarding is creating single-feature customers who are one bad experience away from canceling.
Support ticket volume per customer. A rising ticket rate signals product confusion, which precedes churn by 4–6 weeks. Track it per cohort — if a specific month’s cohort is generating more tickets, something in that period’s onboarding or feature release broke the experience.
Keep reading (related guides):
Full features for 14 days · Secure payment · Stop anytime
Use this calculator on your site
Free to embed. Just paste this code in your HTML.
<iframe src="https://digitaldashboardhub.com/embed-brewery-revenue/" width="100%" height="650" frameborder="0" loading="lazy"></iframe>
Andy Gaber is the founder of Digital Dashboard Hub, a suite of 255+ interactive financial, productivity, and wellness tools. He built DDH after getting frustrated with financial apps that gave outputs without context. Follow along for tool tutorials, revenue analytics breakdowns, and honest takes on personal finance.