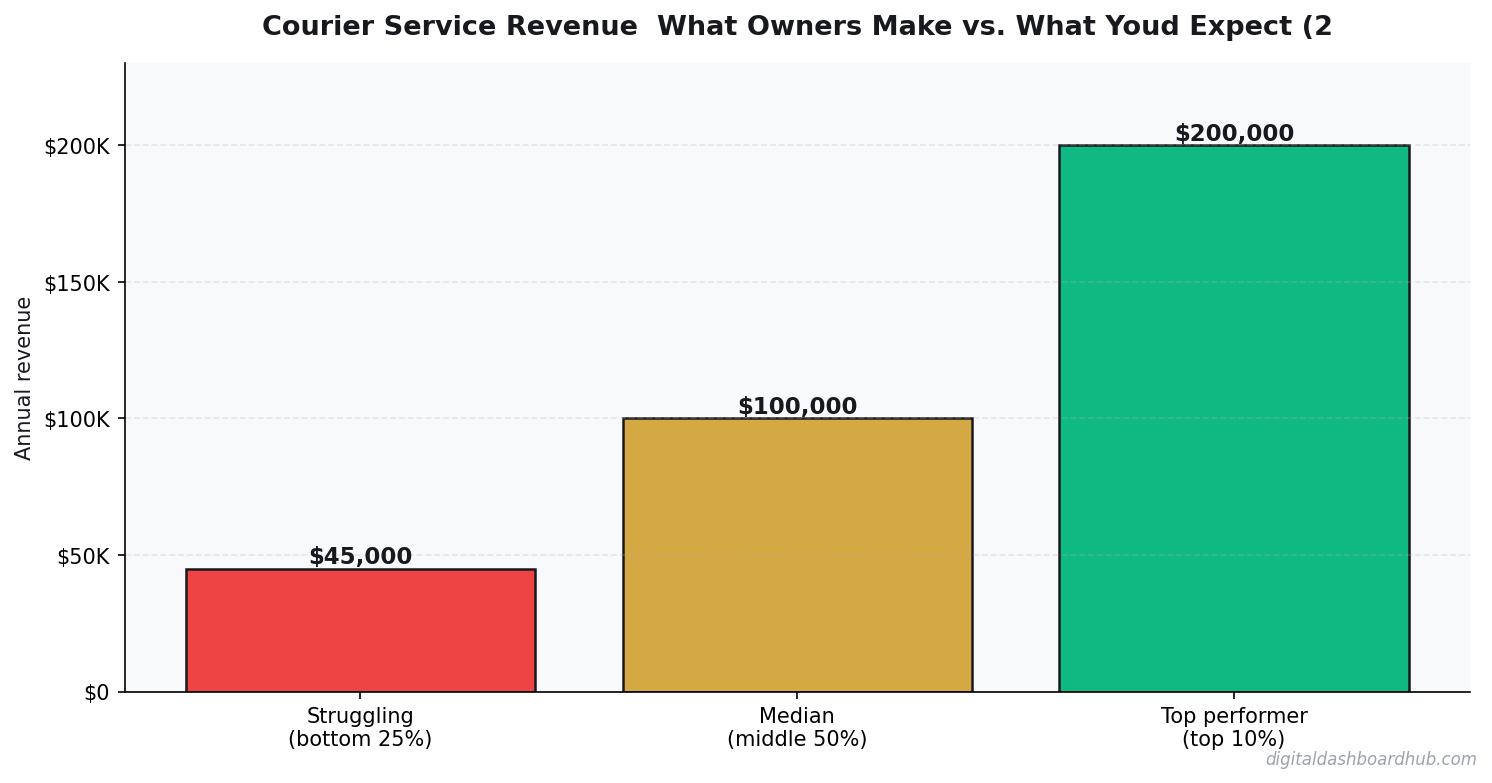
Not all courier service businesses are created equal. The ones making $200K+ per year aren’t working some secret playbook — they just have better numbers on 3-4 key metrics. This calculator shows you exactly which metrics move the needle most.
Use the Free Courier Service Tool
Before you scroll: the calculator below is running in your browser right now. For the full feature set — saved scenarios, history, exports — open the dashboard.
I launched Digital Dashboard Hub because the tools I found online were either too generic or too complicated. Here’s the honest breakdown:
What Courier Service Owners Actually Take Home
A courier service with 3-5 vehicles typically grosses $25K-$50K/month. But fuel ($0.40-$0.60/mile), vehicle depreciation, insurance ($500-$800/vehicle/month), and driver wages leave net margins at 15-22%.
Route density is the profit metric. Ten deliveries in one zip code beats twenty scattered across town.
The Math Most Owners Miss
| Approach | Startup Cost | Time Investment | Revenue Potential | Best For |
|---|---|---|---|---|
| Solo operator | Low ($1K-$10K) | Full time | $60K-$200K/yr | Maximum margins, full control |
| Small team (2-5) | Medium ($10K-$50K) | Management + some fieldwork | $200K-$800K/yr | Scaling without losing control |
| DDH Revenue Tracker | Free trial | 5 min setup | N/A (profit tool) | Know your real numbers in real time |
The biggest line item? Fuel and vehicle maintenance consume 25-35% of revenue — and they’re volatile, so your margins swing month to month.
Switching from per-delivery pricing to route-based contracts with recurring clients increases margin by 8-12% because you optimize stops and reduce dead miles.
The Error That Quietly Kills Margin
Not tracking cost-per-mile accurately. Most courier operators know their revenue per delivery but not their true cost per mile — which includes depreciation, tires, oil, and insurance.
Medical courier work is steady year-round. General delivery spikes 40% in November-December, but so does labor cost.
Inside the Complete Dashboard
How to Use This Calculator
Start by entering your actual numbers — not estimates. Pull from your bank statements, your POS system, or your accounting software. The difference between estimated and real inputs is usually the difference between “this looks fine” and “oh, that’s where the money is going.”
Then change one variable at a time. For courier service, the lever that usually moves the needle most is switching from per-delivery pricing to route-based contracts with recurring clients increases margin by 8-12% because you optimize stops and reduce dead miles. Start there.
If you want to save these projections, track them month-over-month, or model different scenarios side by side, the full dashboard does all of that. Free 14-day trial, no credit card required.
Your Next Move
Related Tools and Articles
- Never Work Again Calculator: The Exact Number by Age
- Workout Progress Tracker: The Method That Finally Kept Me Consistent
- PCOS Symptom Tracking: How Monitoring Your Body Helps You Take Back Control
Common Questions About Courier Service Revenue: What Owners Make vs. What You’d Expect (2026)
How long does it take to see results?
Most people see meaningful progress within 30-90 days when they apply these strategies consistently. The key is tracking your numbers from day one so you have a baseline to measure against.
What’s the biggest mistake people make?
Trying to do everything at once. Pick one or two strategies from this guide, implement them fully, then layer in additional tactics. Spreading yourself thin is the fastest way to see no results from any of it.
Do I need special tools or software?
Not necessarily to start — but the right tools eliminate hours of manual work. Our free calculators and trackers at Digital Dashboard Hub are a good starting point before you invest in paid software.
What a Courier Service Actually Makes: Real Numbers
A 3-vehicle courier operation in Chicago — owner driving plus 2 contracted drivers. They handle medical specimen transport, legal document delivery, and B2B same-day delivery. Average delivery: $45. Each driver completes 12 deliveries/day. Total daily revenue: $1,620. Annual at 250 operating days: $405,000 gross.
Deduct per-mile fuel costs ($0.22/mile average for 3 vehicles doing 80 miles/day each: ~$13,200/year), driver contractor pay (70% of their delivery revenue: $168,000/year), vehicle maintenance and insurance ($18,000/year), dispatch software ($3,600/year), and owner salary ($60,000). Net profit: approximately $142,000. Add in the owner’s own delivery revenue (which the $60K salary doesn’t fully capture) and the picture is considerably better.
The operators clearing $200K+ are running dedicated contract routes, not on-demand only. A hospital system paying you $12,000/month for guaranteed specimen transport is worth more than 267 individual $45 deliveries — same revenue, dramatically less dispatch overhead.
The 3 Factors That Drive Courier Revenue
1. Route density, not just delivery count. 10 deliveries in a 3-mile radius is completely different from 10 deliveries spread across 40 miles. Your fuel and time costs are nearly identical, but the efficiency is radically different. The most profitable courier operators obsessively optimize route density — they’ll turn down distant deliveries during busy periods to protect the economics of their core zone.
2. Client mix: contract vs. on-demand. On-demand delivery feels like high revenue because you’re charging premium rates. But there’s no predictability — you can’t plan staffing, you can’t negotiate volume discounts on fuel, you can’t build a business. Contract clients (medical, legal, retail chains) pay slightly less per delivery but commit to volume. Build your base with contracts, fill spare capacity with on-demand.
3. Vehicle cost management. This is where courier businesses quietly bleed. A van doing 80 miles/day is burning through brake pads, tires, and engine hours at a steady clip. Operators who track cost-per-mile by vehicle can identify when a vehicle becomes unprofitable before it becomes a breakdown liability. The rule of thumb: if your maintenance cost per vehicle exceeds $0.15/mile in a quarter, that vehicle needs attention or replacement.
What Makes a Courier Service Profitable Long-Term
The most durable courier businesses are not competing in the consumer delivery space against DoorDash and Amazon. They’re in specialized B2B niches: medical specimen transport (STAT labs, hospitals), legal document delivery (courts, law firms), pharmaceutical distribution, and high-value item delivery (jewelry, art, luxury retail). These clients pay 2-4x commodity delivery rates and have zero interest in switching to cheaper alternatives because reliability and confidentiality matter.
Breaking into these niches requires credentials (background-checked drivers, insured vehicles, sometimes HIPAA compliance documentation for medical) and referral networks — but once you’re in, the contracts renew automatically and churn is very low. A single hospital system contract at $8,000-$15,000/month is worth more than 30 individual customers paying $300/month each.
The Vehicle Economics Nobody Talks About
A cargo van doing 80 miles/day, 5 days/week, 50 weeks/year is doing 20,000 miles/year. At that pace, an engine replacement or major mechanical failure is a question of when, not whether. Budget 15-20 cents per mile for all vehicle costs (fuel, insurance, maintenance, depreciation toward replacement). For a 3-vehicle operation doing 240,000 miles annually, that’s $36,000-$48,000 in annual vehicle costs — a number that shocks operators who only track the monthly payment.
The operators who manage vehicle costs best run a strict replacement schedule (vehicles retire at 150,000-200,000 miles or a specific cost-per-mile threshold) and maintain a capital reserve for replacement. Driving a vehicle past its useful economic life to avoid a payment is almost always more expensive in total than disciplined fleet management.
Running the Numbers Before You Commit
Whether you’re planning to start a courier service, scale an existing one, or evaluate adding a vehicle, the calculator gives you the marginal analysis that matters most: what does one additional vehicle, driver, or route actually add to the bottom line? Plug in the revenue projection and the cost structure, and the answer comes back in seconds rather than a spreadsheet session. Make the decision on numbers, not instinct.
The courier services that survive and scale are the ones that treat each delivery as a data point, not just a transaction. Which driver, which route, which client, which vehicle, which day of the week — all of it feeds into decisions that compound over time. The calculator above is one tool in that data discipline. Build the habit of running your numbers weekly, not just when something goes wrong.
Keep reading (related guides):
255+ interactive tools for your money, time, and health.
14-day trial · Stripe checkout · Cancel anytime
What Most People Get Wrong
The single biggest mistake is treating revenue as the headline number. Revenue is vanity — margin is sanity, and cash-in-bank is reality. Two operators with identical top-lines routinely end the year $80K apart in take-home, because one priced for volume and the other priced for sustainability. The calculator above forces you to surface that gap before it hits your bank account.
The second mistake is modeling a “best case” and planning around it. The number you should plan around is the 30th-percentile scenario — enough demand to matter, but slower than you hoped. If the business still covers your living expenses there, you have real margin of safety. If it only works in the 80th-percentile case, you are building on sand.
The third mistake is ignoring your time as a cost. If you would otherwise earn $55/hr at a day job and this operation pays you effectively $18/hr for 60-hour weeks, the gap is the real price of running it. Plug your opportunity cost into the calculator and the picture often flips.
How to Pressure-Test Your Numbers
Start with the calculator, then stress-test three levers independently:
- Pricing: What happens to your take-home if you raise prices 10%, but lose 15% of volume? Most operators are surprised to find net income goes up.
- Costs: What happens if your largest input cost rises 20%? This is not hypothetical — it is a typical 12-month swing in most industries.
- Volume: What happens at 70% of your planned volume for 90 days? If that still covers fixed costs, you have a real business. If not, the model is fragile.
Running the calculator three ways takes about ten minutes. The clarity on the other side of those ten minutes is usually the difference between a confident operating plan and guessing for another six months.
Frequently Asked Questions
How accurate is this calculator?
The underlying math uses industry-standard margin and cost ranges sourced from the Courier Service Revenue: What Owners Make vs. What You’d Expect space. Your actual numbers depend on location, seasonality, and operating style, so treat this as a directional benchmark, not a guarantee. The more precisely you enter your inputs, the tighter the output range becomes.
Can I save my results?
A free Digital Dashboard Hub account saves every scenario you run, lets you compare side-by-side, and unlocks the full dashboard with expense tracking and month-over-month charts. The 14-day trial includes the complete tool library — no credit card required to start.
Who is this tool for?
It’s built for anyone pressure-testing a real decision — existing operators auditing their margins, side-hustlers deciding whether to go full-time, and prospective owners trying to sanity-check a business plan before signing a lease. You do not need any accounting background to use it.
What should I do with the results?
Start by comparing the output against your current (or projected) monthly take-home. If the gap is big, walk back the inputs and identify which lever — pricing, volume, or cost structure — is doing the damage. That is usually where the highest-leverage fix lives.
The Bottom Line
Most operators lose money not because the math is impossible, but because they never actually ran it. Fifteen minutes with the calculator beats three months of guessing. Run your numbers, screenshot the output, and use it as the baseline for every pricing and cost decision over the next quarter.
When you are ready to go deeper, the full Digital Dashboard Hub workspace lets you save scenarios, track actuals month-over-month, and see the trend before problems compound. That is the version that actually compounds the effort — spreadsheets forgotten in a Google Drive folder do not.
Next Steps
- Run the calculator above with your best current estimates.
- Re-run it with a pessimistic scenario (lower volume, higher costs) and a stretch scenario (better pricing, more efficient ops).
- Screenshot all three outputs so you have a baseline to compare against when reality arrives.
- Revisit monthly — the number that matters is the one that changes with your real P&L.
Ready for the full dashboard?
Unlock all 255 tools across business, creator, and health workflows.
Andy Gaber is the founder of Digital Dashboard Hub, a suite of 255+ interactive financial, productivity, and wellness tools. He built DDH after getting frustrated with financial apps that gave outputs without context. Follow along for tool tutorials, revenue analytics breakdowns, and honest takes on personal finance.