I spent months in therapy without a clear picture of my progress. Then I started keeping data. Mental health is hard enough to manage. Trying to communicate your progress — or lack of it — to a therapist, psychiatrist, or even yourself? That’s where most people get stuck.
Why Data Helps Mental Health Recovery
Before you scroll: the calculator below is running in your browser right now. For the full feature set — saved scenarios, history, exports — open the dashboard.
There’s a cognitive bias called the “peak-end rule” — your brain remembers the most intense moment and the most recent moment, and averages those to form your overall memory. For mental health, this means:
- You had 25 decent days and 5 terrible ones. You remember the month as terrible.
- Your medication is working for 6 out of 7 days. You focus on the one bad day and think it isn’t helping.
- Your anxiety dropped by 30% over 3 months. You can’t feel the difference because it happened gradually.
Tracking breaks through that bias. Numbers don’t have mood-congruent recall. They show you what actually happened, not what your brain decided to save. For more on how tracking supports mental health, see Gratitude Journal Tracker: The 5-Minute Daily Practice That Changes Everything.
What to Track for Grief (Without Making It Worse)
The biggest concern with mental health tracking is valid: won’t focusing on symptoms make me feel worse? Research says no — but only if you track the right way.
The Healthy Tracking Framework
- Keep it brief: 60 seconds max per entry. Long journal entries can become rumination.
- Track positive data too: Log what helped, what went well, what you’re grateful for alongside symptoms.
- Use numbers, not narratives: A 1-10 scale captures your state without forcing you to relive the details.
- Look at trends, not single days: Any single data point is noise. The trend over weeks tells the real story.
The goal isn’t to analyze yourself into a hole. It’s to gather enough information that you and your care team can make better decisions.
How the DDH Grief Loss Journal Supports Your Journey
I designed this tool with two principles: it should take less than 90 seconds, and it should never feel like homework.
Step 1: Quick daily check-in. Mood score, energy level, and up to 3 optional fields you customize (sleep quality, medication notes, coping strategies used). Tap-based, not type-based.
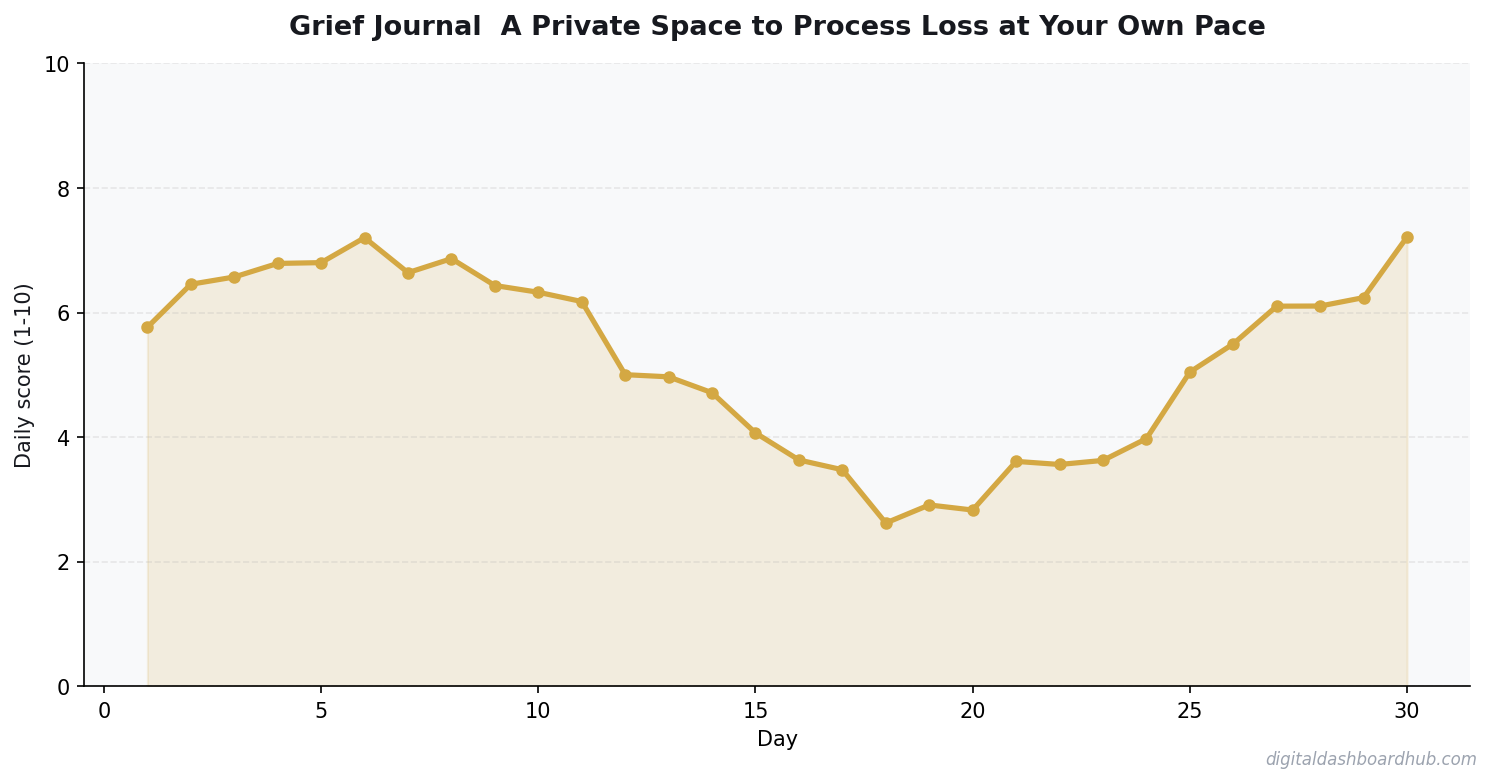
Step 2: Visual trend dashboard updates in real time. See your mood trajectory over 7, 14, 30, and 90 days. Color-coded so improvement is immediately visible — you don’t need to interpret charts.
Step 3: Between-session summaries for your therapist or provider. One-tap export shows patterns, triggers, and your own notes. This turns a 15-minute catch-up appointment into a targeted working session.
The feature that people message me about most: the “small wins” counter. It highlights positive data points you might have missed — a week where your score improved slightly, a coping strategy that worked 4 out of 5 times, a trigger you successfully avoided. Mental health progress is slow. This helps you see it.
Ready to start? Try the Grief Loss Journal free for 14 days → No credit card, no commitment. It’s one of 255+ tools in the DDH wellness platform.
Mental Health Tracking Tools Compared
| Feature | Therapy Apps | Mood Apps | DDH Tracker |
|---|---|---|---|
| Provider-ready reports | No | Some | Built-in |
| Positive data tracking | Varies | Rare | Core feature |
| Daily time | 10-20 min | 2-5 min | 60-90 sec |
| Cost | $60-300/mo | Free-$10/mo | Free trial |
FREE BONUS: Grief Tracking Quick-Start Guide
A 1-page printable with the exact metrics to track daily, what patterns to watch for, and how to share data with your provider.
How Grief Actually Moves (It’s Not Stages)
The five stages of grief were never meant to be a linear roadmap — they were descriptive categories that show up in grief, not a sequence you’re supposed to complete in order. But most people still feel like they’re doing grief wrong when they cycle back to anger after feeling acceptance, or when numbness returns months after they thought they were through the worst of it.
Your grief doesn’t follow a schedule. A tracker isn’t there to tell you how far you’ve progressed — it’s there to make the experience legible when it feels chaotic, and to capture the full range of what’s happening so nothing gets suppressed or rushed.
What Journaling in Grief Actually Does
Writing about loss activates the prefrontal cortex — the part of the brain that creates meaning and narrative. Grief lives primarily in the limbic system (pure emotion, no language). The act of writing is literally the act of building a bridge between feeling and meaning. That bridge is part of how grief resolves over time.
You don’t have to write well. You don’t have to write coherently. The point isn’t the output — it’s the process of externalizing what’s inside. Private entries that no one ever reads accomplish the same neurological work as published memoirs.
What to Do When You’re Not Ready to Write
Some days, the journal is too much. The blank page feels like a demand you can’t meet. On those days, a single word captures something — “hard,” “tired,” “okay,” “waves.” Rating your day on a 1-10 scale requires nothing. Coming back to the tracker at all, even briefly, maintains the habit of paying attention to what you’re experiencing without requiring more than you have.
There is no minimum viable grief journaling. Show up in whatever form you can. The tracker meets you there.
When to Bring Tracker Data to a Therapist or Doctor
Grief is not mental illness, and it doesn’t require treatment. But some grief patterns do warrant professional support: persistent inability to function in daily life beyond 6-8 weeks, grief that intensifies over time rather than fluctuating, prolonged sleep disruption, and thoughts of harming yourself. A months-long log that shows these patterns is valuable clinical information. Bring it. The data speaks where words sometimes can’t.
Keep reading (related guides):
- How Much Does Therapy Cost in 2026? A State-by-State Breakdown
- Free ADHD Impulse Spending Tracker — Try It Now
- ADHD Cleaning Hacks: How to Keep Your Space Tidy Without Overwhelm
- Stress Level Tracker: How Measuring Your Stress Helps You Actually Manage It
- Etsy Seller Revenue Calculator: Project Your Monthly Shop Income
255+ interactive tools for your money, time, and health.
14-day trial · Stripe checkout · Cancel anytime
⚡ Quick Grief Loss Journal Score
Track your symptoms in 30 seconds.
Basic score only. Get the full tracker with 255+ tools →
Your Next Move
Right now (60 seconds): Rate your current mood on a 1-10 scale and write down one thing that influenced it today. That’s your first data point.
This week: Do that same check-in for 5 days. Don’t aim for perfect — 3 out of 5 still gives you useful baseline data.
The long play: Start using the DDH Grief Loss Journal. Free for 14 days, takes 60 seconds to set up. After a month, you’ll have data that makes every therapy session more productive and every medication check more precise.
Questions people ask before using this tool
How long before a Grief Journal shows useful patterns?
Most users start spotting patterns at the 3-4 week mark. Anything shorter and the data is too noisy to separate signal from coincidence. Commit to daily (or near-daily) entries for a full month before you decide whether the tool is earning its keep.
What should I show my doctor from a Grief Journal?
The summary view, not the raw log. Doctors have 7-15 minutes — lead with the trendline, the frequency, and any obvious correlations (trigger foods, stress, sleep). If they want more detail, offer the full log. Most appointments go better with less paper, not more.
Can a Grief Journal replace medical testing?
No. What it replaces is the ‘I think my symptoms got worse around February’ guessing game. Your logs become ammunition for tests your doctor orders — they will not order a workup on ‘feeling off,’ but will on ‘logged 14 episodes across 30 days.’
What if my Grief Journal entries trigger anxiety about my symptoms?
Drop to weekly entries and only log the summary, not every fluctuation. The goal is information, not vigilance. If tracking itself becomes the symptom, the tool is not earning its place — talk to a therapist or care provider about reframing the data relationship.
How is a Grief Journal different from a journal?
A Grief Journal forces structured fields — severity, duration, triggers, context — so patterns surface in aggregate. A journal captures nuance one day at a time. Use the tracker for the ‘what/when/how much’ questions and a journal for the ‘why do I feel this way’ ones.
Do I need to log every single day for a Grief Journal to work?
No. Aim for 5 of 7 days. The gaps tell you something too — what days you were too symptomatic or too busy to log. Perfectionism is the #1 reason people quit health trackers in week three. Forgive gaps, keep going.
Seven mistakes to avoid with this Grief Journal tool
- Stopping the tracker when symptoms improve. The baseline of ‘feeling fine’ is what makes the next flare visible — keep logging through the calm stretches.
- Forgetting to log context. A pain score without ‘what you ate/slept/did’ is a number without a story. Context is where patterns live.
- Panicking at week-two data. Short windows are noisy. Do not make medical decisions off 10 days of entries — 30 is the minimum meaningful dataset.
- Logging only on bad days. The baseline is what makes the spikes legible — if you skip good days, every entry looks alarming.
- Sharing raw data with your care team. Export the summary; they have seven minutes. The trendline and top 3 correlations earn their attention.
- Using the tracker to self-diagnose. Its job is to surface patterns and feed your doctor better data, not replace the visit.
- Creating too many custom fields. Every extra field is a reason to skip the log. Start with 3-4 core fields and add more only after a month.
The value of a Grief Journal tracker is not the data — it is the pattern recognition that compounds over months. Three entries a week for a year will outperform 30 entries in a single panicked month.
When to use this Grief Journal tracker (and when to skip it)
This Grief Journal tracker is most valuable in three windows: after a new diagnosis (first 90 days, building the baseline), during a medication or treatment change (when you need data on what is actually shifting), and before any specialist appointment (so your care team has more than your subjective recall to work with).
Skip the tool when it is creating more anxiety than insight. For some people, daily symptom logging becomes its own source of stress — if that is you, downshift to weekly summary entries or pause entirely for 30 days. The data is only valuable if the act of tracking doesn’t make your condition worse; listen to that signal if it shows up.
Used well, three to six months of consistent data is often more useful than any single test. Doctors frequently order a workup only when they see a pattern, and your logs are exactly that pattern. Bring the summary view to appointments, not the full log, and lead with ‘here is what I noticed’ — that framing changes how the conversation goes.
Grief Journal quick reference checklist
Print this or bookmark it — the Grief Journal works best when you keep these basics in view.
- You noticed at least one pattern in the last 30 days of data.
- You know which summary view to export for your next medical appointment.
- The entries include context — food, sleep, stress, medication — not just the raw score.
- You are logging calm stretches too — the baseline is what makes flares visible.
- You have logged on at least 5 of the last 7 days (or the last 3 if mid-flare).
- The tool takes you under 90 seconds a day; if it takes longer, trim a field.
What to do next
Once you have walked the checklist, scroll back up and run your real inputs in the interactive Grief Journal tool — it takes about 60 seconds. If you want to compare this against the other 254+ calculators, trackers, and planners in the DDH library, the full set lives at app.digitaldashboardhub.com. Free tier covers the core version of every tool; upgrades unlock cross-tool dashboards, scenario saving, and team sharing.
If you are brand new to the DDH toolkit, start with three tools: one that directly serves your primary goal this quarter, one that catches problems before they compound, and one just for fun. That mix prevents the usual fate of productivity tools — great first month, forgotten by month three.
Keep Reading
- Gratitude Journal Tracker: The 5-Minute Daily Practice That Changes Everything
- Best Therapy Journal Apps for Mental Health Support (I Tested 7)
- How to Start a Gratitude Practice (Free Tracker Tool Inside)
- CBT Worksheet Tracker: The Free Tool That Makes Doctor Visits Actually Useful
Common Questions About Grief Journal: A Private Space to Process Loss at Your Own Pace
How long does it take to see results?
Most people see meaningful progress within 30-90 days when they apply these strategies consistently. The key is tracking your numbers from day one so you have a baseline to measure against.
What’s the biggest mistake people make?
Trying to do everything at once. Pick one or two strategies from this guide, implement them fully, then layer in additional tactics. Spreading yourself thin is the fastest way to see no results from any of it.
Do I need special tools or software?
Not necessarily to start — but the right tools eliminate hours of manual work. Our free calculators and trackers at Digital Dashboard Hub are a good starting point before you invest in paid software.

Andy Gaber is the founder of Digital Dashboard Hub, a suite of 255+ interactive financial, productivity, and wellness tools. He built DDH after getting frustrated with financial apps that gave outputs without context. Follow along for tool tutorials, revenue analytics breakdowns, and honest takes on personal finance.