Most Coffee Shop Owners Sign the Lease Before They Run the Numbers
Jump in: the tool below is live and free to play with. Upgrade to a dashboard account when you want to save scenarios and track over time.
I launched Digital Dashboard Hub because the tools I found online were either too generic or too complicated. Here’s the honest breakdown:
Key Takeaway
In This Article
- Most Coffee Shop Owners Sign the Lease Before They Run the Numbers
- Step 1: Calculate Your Drinks-Per-Day Requirement
- Step 2: Figure Out Your Average Ticket (It’s Not Just Coffee)
- Step 3: Stress-Test Your Location Before Signing
- How the DDH Coffee Shop Revenue Calculator Handles This
- Step 4: Model Your First-Year Revenue Curve (It’s Not Linear)
- Step 5: The Food Strategy That Changes Everything
- Step 6: Know Your Break-Even Number Cold
- The “Should I Do This?” Decision Framework
- Start Here
Scenario A: 150 daily transactions, 20% food attach, average food item $4.50. Food revenue = 30 items × $4.50 = $135/day = $4,050/month. At a 60% food margin, that’s $2,430 in gross profit.
I talk to a lot of aspiring coffee shop owners. The conversation always starts the same way: they found a cute space, they love the neighborhood, they can already picture the exposed brick and the hand-lettered menu board. What they can’t picture is the math.
Pro Tip
The numbers in this article come from real data — not projections or best-case scenarios.
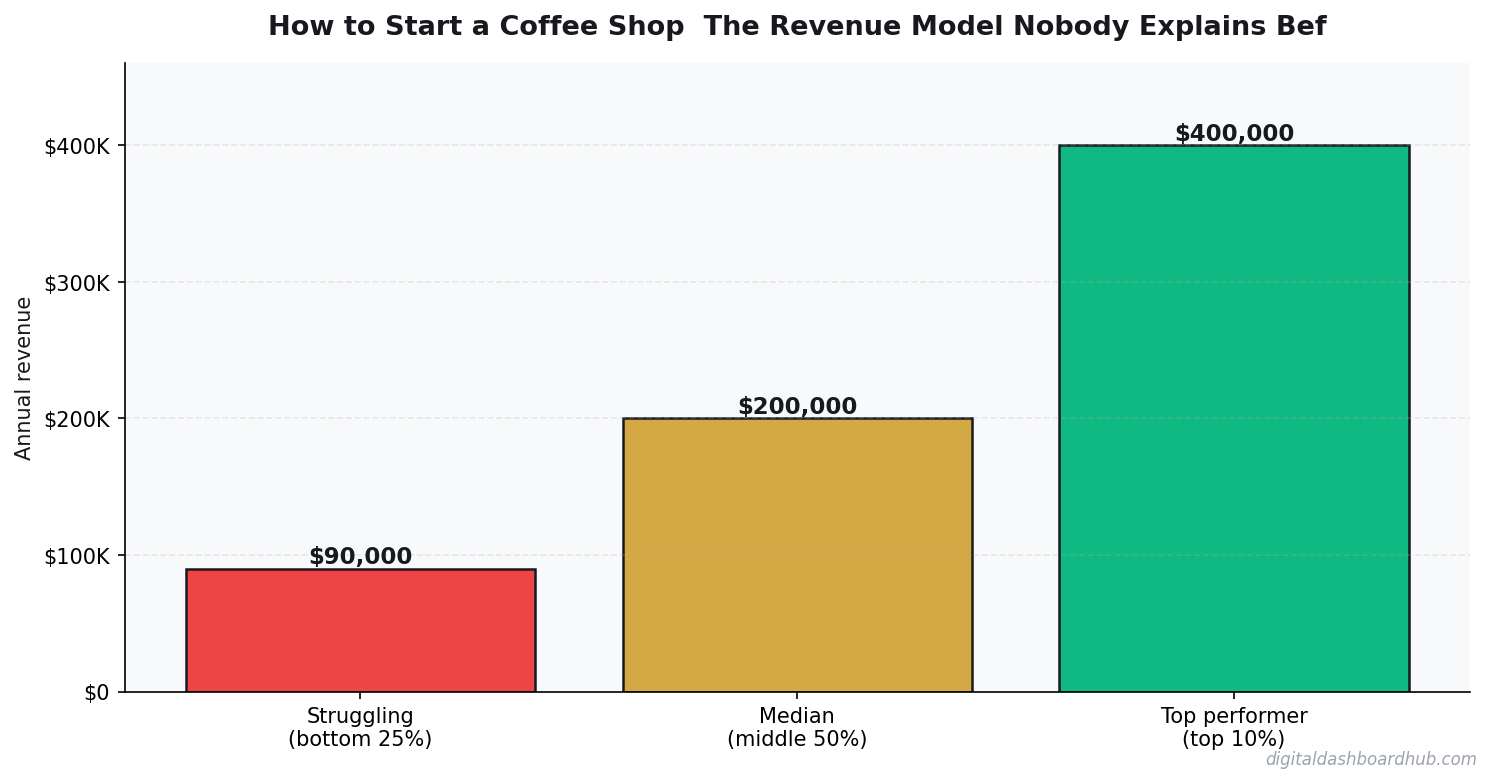
Here’s the uncomfortable truth about coffee shops: the average independent cafe in the U.S. brings in between $215,000 and $500,000 in annual revenue. That sounds decent until you realize margins run 2-6% for most operators. On a $300K shop, that’s $6,000 to $18,000 in actual profit. For the year. Before you pay yourself.
The difference between a coffee shop that works and one that bleeds money for three years before closing isn’t the beans, the vibe, or even the location. It’s the revenue model. And nobody walks you through that model before you sign a lease that locks you in for five to ten years.
This guide is the revenue model. We’re going to build one from scratch, step by step, so you can see exactly what your shop needs to hit before you commit a dime.
Step 1: Calculate Your Drinks-Per-Day Requirement
Everything in a coffee shop flows from one number: drinks sold per day. Not revenue, not foot traffic, not Instagram followers. Drinks per day. This is the heartbeat of the business.
Here’s how to find your number. Start with your monthly fixed costs:
Let’s say you’re mid-market at $15,000/month in fixed costs. Your average drink price is $5.50, and your cost of goods sold (COGS) on beverages is about 25%. That means you keep $4.13 gross profit per drink.
$15,000 ÷ $4.13 = 3,632 drinks per month, or about 121 drinks per day (open 30 days). That’s your baseline. Below that, you’re losing money every single day.
Step 2: Figure Out Your Average Ticket (It’s Not Just Coffee)
Here’s where most projections fall apart. People model a coffee shop as “sell lattes all day.” In reality, your average ticket is a blend of drink sizes, add-ons, food, and merchandise. The shops that survive push that average ticket up relentlessly.
A typical ticket breakdown for a healthy shop looks like this: 65% of transactions are drink-only at an average of $5.25. 25% are drink-plus-food at an average of $9.80. 10% are food-only or merchandise at an average of $6.50. That gives you a blended average ticket of about $6.45.
That extra $0.95 over the drink-only price doesn’t sound like much. But across 150 transactions per day, it’s an extra $142.50 daily, or $4,275 per month. That’s the difference between breaking even and actually taking a paycheck.
The food attach rate — the percentage of drink buyers who also buy food — is the single most important metric most coffee shop owners ignore. Industry average is around 20-25%. Top performers hit 35-40%. Every 5% increase in your food attach rate adds roughly $1,000-1,500 to your monthly revenue.
Step 3: Stress-Test Your Location Before Signing
I don’t care how cute the space is. You need to count feet before you count beans.
Here’s the method I recommend: spend three days — one weekday morning, one weekday afternoon, one weekend morning — sitting outside the target location counting pedestrians. You want foot traffic during your planned operating hours, not just “this area seems busy.”
The rough conversion math: about 1-3% of pedestrian foot traffic will walk into a coffee shop they notice. If you count 500 people walking past during your operating hours, expect 5-15 walk-in customers. If you need 150 transactions per day to hit your numbers, walk-in traffic alone won’t carry you. You need destination traffic — regulars who drive to you.
Location red flags that kill revenue models:
- No street parking within one block (kills the “quick stop” customer)
- Competing shop within 3-minute drive that already has loyal regulars
- Office-heavy area with dead weekends (you lose 30% of potential revenue days)
- No visibility from the main road (your marketing costs double)
How the DDH Coffee Shop Revenue Calculator Handles This
This is a lot of math to do on paper, and one wrong assumption cascades through everything. The DDH Coffee Shop Revenue Calculator lets you plug in your specific rent, labor costs, drink prices, food attach rate, and foot traffic estimates — then shows you exactly how many drinks per day you need to break even.
What makes it actually useful: you can run scenarios. What if rent is $1,000 higher? What if food attach drops to 15%? What if you add a drive-through window? The calculator shows you which variables matter most for YOUR specific setup, not some generic national average.
You can also model the first-year ramp. Most shops don’t hit full volume for 6-12 months. The calculator lets you set month-by-month traffic growth so you can see how much cash runway you actually need to survive the slow period.
Step 4: Model Your First-Year Revenue Curve (It’s Not Linear)
New coffee shop owners project revenue like a flat line: “We’ll do $25,000/month from day one.” That never happens. Month one is typically 30-40% of your steady-state volume. Month three is 50-65%. You usually don’t hit full stride until month 8-12.
The data revealed a realistic first-year curve looks like for a mid-market shop with a $25,000/month steady-state target:
That cumulative cash burn column is critical. You need about $12,000-$15,000 in working capital beyond your buildout costs just to survive the ramp period. Most first-time owners don’t budget for this and end up cutting staff too early, which kills service quality, which kills the repeat visit rate, which kills the business.
Step 5: The Food Strategy That Changes Everything
I said food attach rate is the most underrated metric. Let me back that up with math.
Scenario A: 150 daily transactions, 20% food attach, average food item $4.50. Food revenue = 30 items × $4.50 = $135/day = $4,050/month. At a 60% food margin, that’s $2,430 in gross profit.
Scenario B: Same shop, but you push food attach to 35% with better display, a bakery partner, and a combo pricing strategy. Food revenue = 52 items × $4.50 = $234/day = $7,020/month. Gross profit: $4,212/month.
That’s an extra $1,782/month in profit from the same number of customers. You didn’t need more foot traffic, better beans, or a bigger space. You needed a muffin display at eye level and a sign that says “Add a croissant for $2.”
The food strategies that work for independent shops: partner with a local bakery for daily delivery (you avoid the equipment and labor cost of baking in-house). Offer 2-3 breakfast sandwiches made in a panini press (low skill, high margin). Keep a grab-and-go cold case with pre-made salads and wraps for the lunch crowd. And always, always have a combo deal visible at the register.
Step 6: Know Your Break-Even Number Cold
Your break-even number is the one metric you should be able to recite in your sleep. It’s different from “drinks per day needed” because it includes everything: labor, rent, COGS, loan payments, insurance, and your minimum owner salary.
Yes, include your salary. A business that requires you to work 60 hours a week for free isn’t a business. It’s an unpaid internship you’re paying $150,000 to attend.
The formula: (Monthly Fixed Costs + Owner Salary) ÷ (Average Ticket × (1 – COGS%)) = Transactions Per Day Needed ÷ Days Open.
For a mid-market shop: ($15,000 + $4,000) ÷ ($6.45 × 0.70) = $19,000 ÷ $4.52 = 4,204 transactions/month = 140 transactions/day.
If your location can’t reasonably support 140 transactions per day, the math doesn’t work. Period. No amount of great coffee or cool branding fixes bad math.
The “Should I Do This?” Decision Framework
Before you sign anything, answer these five questions with real numbers:
- Can my location support the daily transaction volume I need? (Count feet, check competitor density, verify parking)
- Do I have 18 months of working capital beyond buildout? (Not 6 months. Eighteen. Because months 1-8 are cash-negative.)
- Is my rent below 10% of projected revenue? (Above 15% and you’re in the danger zone. The industry calls it “rent death.”)
- Can I get food attach above 25% from month one? (If you’re drink-only, your margins will be brutal.)
- Am I prepared to work 60+ hours/week for the first year while paying myself less than minimum wage? (This is the real cost nobody talks about.)
If any answer is no, go back to the model and adjust until it works — or walk away from this particular deal. There will be other spaces.
Start Here
- Build your model. Open the DDH Coffee Shop Revenue Calculator and plug in your real numbers. Not optimistic numbers. Real numbers. Run three scenarios: pessimistic, realistic, and optimistic.
- Count feet at your target location. Three sessions minimum. Compare observed foot traffic to the transaction volume your model requires.
- Set a kill switch. Before you sign anything, decide the monthly revenue number that means “this isn’t working” and put a date on it. If you haven’t hit X by month Y, you have a plan to exit without losing everything.
The coffee shop dream is real. But the dream survives on math, not vibes. Run your numbers first — your future self (and your bank account) will thank you.
$0
To Get Started
Full access during your trial period
- Freelancer Finance Dashboard: Track Income, Taxes, and Cash Flow in One Visual Hub
- The Side Hustle Tax Trap: Track Every Dollar
- Rental Property ROI Calculator
Keep reading (related guides):
255+ interactive tools for your money, time, and health.
Instant signup · Stripe-secure · Cancel in one click
Andy Gaber is the founder of Digital Dashboard Hub, a suite of 255+ interactive financial, productivity, and wellness tools. He built DDH after getting frustrated with financial apps that gave outputs without context. Follow along for tool tutorials, revenue analytics breakdowns, and honest takes on personal finance.