Not all coffee shop businesses are created equal. The ones making $200K+ per year aren’t working some secret playbook — they just have better numbers on 3-4 key metrics. This calculator shows you exactly which metrics move the needle most.
Use the Free Coffee Shop Tool
Scroll down — the interactive tool runs live with your inputs. Full version lives inside Digital Dashboard Hub. Two-click trial, Stripe-secure.
I launched Digital Dashboard Hub because the tools I found online were either too generic or too complicated. Here’s the honest breakdown:
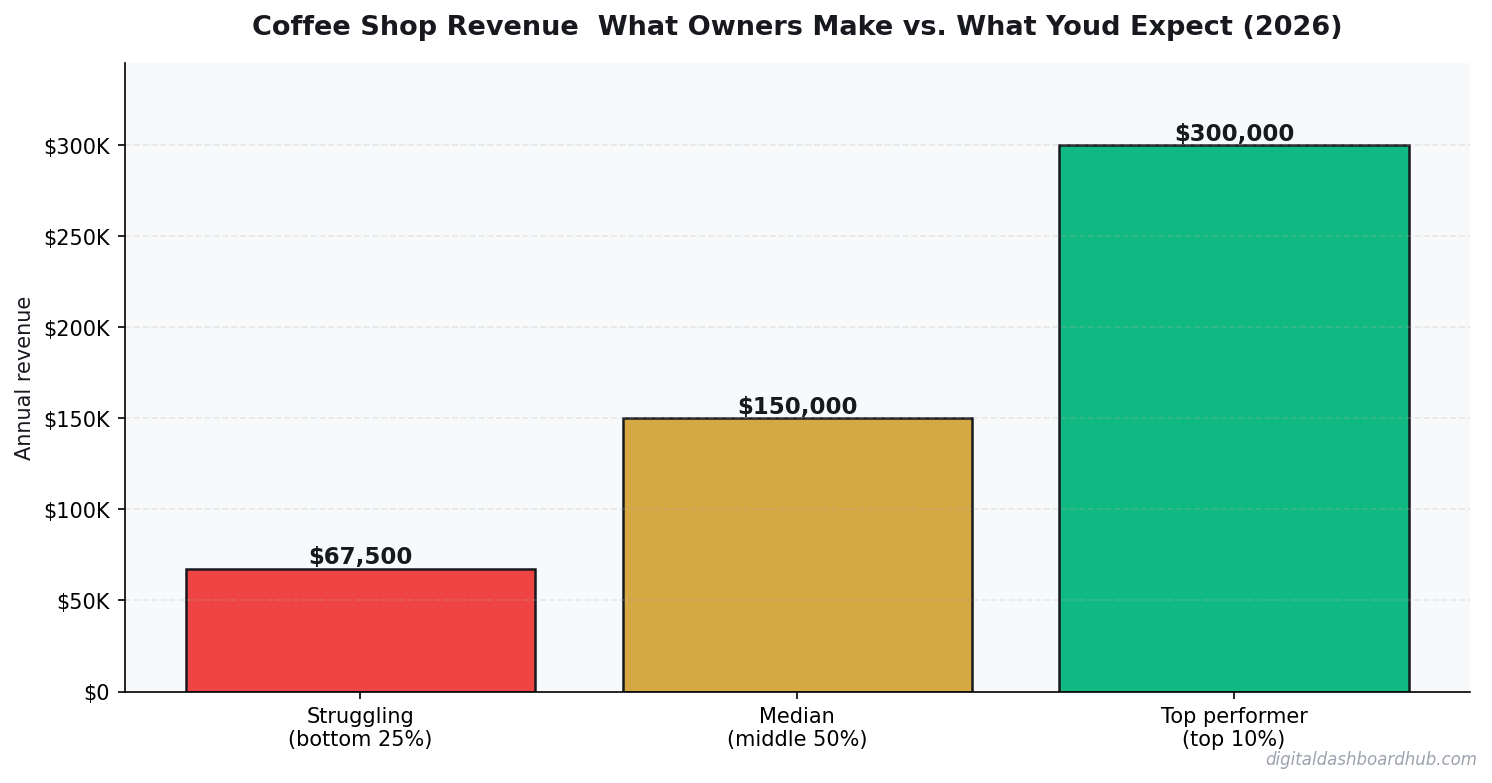
What Coffee Shop Owners Actually Take Home
An independent coffee shop doing 200-300 transactions/day grosses $25K-$45K/month. After COGS (25-30%), labor (30-35%), rent (10-15%), and utilities, net margins land at 10-15%. That $40K month might leave $5K in your pocket.
Drink margins are 70-80%. Food margins are 30-40%. Your menu mix determines everything.
The Financial Reality
| Approach | Startup Cost | Time Investment | Revenue Potential | Best For |
|---|---|---|---|---|
| Solo operator | Low ($1K-$10K) | Full time | $60K-$200K/yr | Maximum margins, full control |
| Small team (2-5) | Medium ($10K-$50K) | Management + some fieldwork | $200K-$800K/yr | Scaling without losing control |
| DDH Revenue Tracker | Free trial | 5 min setup | N/A (profit tool) | Know your real numbers in real time |
The biggest line item? Rent and labor together eat 50-60% of revenue — in a high-traffic location, you’re paying for foot traffic whether it converts or not.
Increasing average ticket by $1.50 (adding a pastry or size upgrade) on 250 daily transactions adds $11K/month in revenue at 65% margin.
The Profit Killer You’re Not Tracking
Tracking daily sales but not transactions-per-labor-hour. If you’re staffing 3 people during a 40-transaction hour, you’re losing money on those wages.
Summer cold brew actually outperforms winter hot coffee in many markets. The real dip is January-February when foot traffic drops 20-25%.
Beyond the Calculator: The Full Dashboard
How to Use This Calculator
Start by entering your actual numbers — not estimates. Pull from your bank statements, your POS system, or your accounting software. The difference between estimated and real inputs is usually the difference between “this looks fine” and “oh, that’s where the money is going.”
Then change one variable at a time. For coffee shop, the lever that usually moves the needle most is increasing average ticket by $1. Start there.
If you want to save these projections, track them month-over-month, or model different scenarios side by side, the full dashboard does all of that. Free 14-day trial, no credit card required.
Your Next Move
Related Tools and Articles
- The Small Business Owner’s Guide to Expense Tracking (Without Losing Your Mind at Tax Time)
- Amazon FBA Revenue Calculator: What Sellers Actually Make in 2026
- Why People with ADHD Start Everything and Finish Nothing (And 7 Systems That Actually Help)
Common Questions About Coffee Shop Revenue: What Owners Make vs. What You’d Expect (2026)
How long does it take to see results?
Most people see meaningful progress within 30-90 days when they apply these strategies consistently. The key is tracking your numbers from day one so you have a baseline to measure against.
What’s the biggest mistake people make?
Trying to do everything at once. Pick one or two strategies from this guide, implement them fully, then layer in additional tactics. Spreading yourself thin is the fastest way to see no results from any of it.
Do I need special tools or software?
Not necessarily to start — but the right tools eliminate hours of manual work. Our free calculators and trackers at Digital Dashboard Hub are a good starting point before you invest in paid software.
What a Coffee Shop Actually Earns: A Worked Example
Standalone coffee shop in a walkable neighborhood in Atlanta. 400 sq ft, 1 owner-operator plus 2 part-time baristas. Peak morning rush (6am-10am) drives 80% of the day’s volume. Total daily transactions: 140. Average ticket: $7.50. Daily gross: $1,050. Annual gross at 355 operating days: $372,750.
Coffee shop margins are punishing. Ingredients and cups: 25% COGs ($93,000). Labor including yourself: $72,000. Rent in a walkable neighborhood at $3,800/month: $45,600. Everything else — equipment maintenance, POS, insurance, WiFi, waste: $28,000. Owner take-home: roughly $134,000. On a 355-day-a-year operation. That’s why so many coffee shops fail — the margin works only if you run it lean and stay personally involved.
The shops doing $200K+ in owner income are almost always running food alongside coffee. A $4 croissant alongside a $6 latte raises the average ticket to $10+ with minimal added labor. Food COGs are higher than coffee, but the revenue lift more than compensates.
The 3 Factors That Move Coffee Shop Revenue Most
1. Throughput during peak hours. Your busiest 2 hours often generate 50-60% of your daily revenue. A barista who can make 4 drinks/minute vs. 2 drinks/minute during the 8am rush isn’t just faster — that’s the difference between 100 customers served and 50 customers served (or 50 customers walking out). Training, equipment, and workflow design during peak hours are the highest-ROI investments a coffee shop owner can make.
2. Ticket size, not just transaction volume. Most coffee shop marketing is focused on getting more people in the door. But a customer you already have is free to sell to. Suggesting a food pairing, offering a larger size, or promoting seasonal drinks are all zero-acquisition-cost revenue opportunities. Shops that actively manage average ticket through barista training typically run $1.50-$3 higher average transactions than shops that don’t.
3. Subscription and loyalty program revenue. Coffee is uniquely suited to subscriptions because the purchase is already habitual. A “coffee subscription” at $89/month (1 drink/day) vs. buying individual drinks at $6 is actually a discount for the customer but predictable cash flow for you. Even 50 subscribers adds $4,450/month in guaranteed revenue before the shop opens. The math on loyalty programs is similarly compelling — the behavioral lock-in of a punch card or app points keeps customers from wandering to the competitor down the street.
What Makes a Coffee Shop Actually Survive (Most Don’t)
The failure rate for independent coffee shops in the first 5 years is often cited at 60-70%, and the reason is almost never the coffee quality. It’s overhead creep, seasonal revenue variance, and underestimating the capital required to survive the slow months while building a customer base.
The coffee shops that survive and thrive have one thing in common: they hit breakeven within 12 months of opening. Getting to breakeven requires knowing your exact monthly fixed costs before you open, and structuring your launch so your opening-month revenue gets you reasonably close.
The shops that do well long-term have a community angle the chains can’t replicate. A coffee shop that’s known in the neighborhood as the place where the local running club meets, where the freelancers work, where the school drop-off crowd knows the staff by name — that shop has switching costs the Starbucks down the street simply doesn’t have. You’re not competing on menu or efficiency. You’re competing on belonging.
The #1 Financial Mistake Coffee Shop Owners Make
Treating equipment leases as a way to preserve cash. A $12,000 espresso machine on a 36-month lease at $380/month costs you $13,680 by the end — for equipment that will be 3 years old and likely need maintenance. If you can purchase outright with cash or a low-rate SBA loan, you should. The monthly “cash preservation” logic ignores the total cost of capital and leaves ongoing fixed overhead on your P&L forever.
The SBA 7(a) loan is specifically designed for equipment purchases and can offer 10-year repayment terms at below-market rates for qualifying small businesses. If you’re opening a coffee shop with financing, understanding your loan options is as important as your espresso recipe.
Common Mistakes That Bleed Coffee Shop Profit
Over-scheduling staff. Labor is the #1 variable cost in a coffee shop, and the instinct to “always have coverage” results in paying 3 people during the 2pm-5pm lull when 1 person could handle it. Analyze your hourly transaction data — most POS systems give you this — and schedule to the traffic, not to your comfort level about being shorthanded.
Not managing waste. Pastries and food items that don’t sell by close represent pure margin destruction. Track your end-of-day waste for 30 days, calculate its cost, and adjust your par levels. Most coffee shops find they’re wasting $800-$1,500/month in unsold food before they ever look at the numbers systematically.
The owners who thrive treat their coffee shop like a data business, not a hospitality business. The hospitality instinct — make everyone happy, keep it fully stocked, be generous with staff hours — is what creates the experience. The data discipline is what makes it profitable. You need both.
Keep reading (related guides):
255+ interactive tools for your money, time, and health.
14 days free · No charge today · 2-click cancel
What Most People Get Wrong
The single biggest mistake is treating revenue as the headline number. Revenue is vanity — margin is sanity, and cash-in-bank is reality. Two operators with identical top-lines routinely end the year $80K apart in take-home, because one priced for volume and the other priced for sustainability. The calculator above forces you to surface that gap before it hits your bank account.
The second mistake is modeling a “best case” and planning around it. The number you should plan around is the 30th-percentile scenario — enough demand to matter, but slower than you hoped. If the business still covers your living expenses there, you have real margin of safety. If it only works in the 80th-percentile case, you are building on sand.
The third mistake is ignoring your time as a cost. If you would otherwise earn $55/hr at a day job and this operation pays you effectively $18/hr for 60-hour weeks, the gap is the real price of running it. Plug your opportunity cost into the calculator and the picture often flips.
How to Pressure-Test Your Numbers
Start with the calculator, then stress-test three levers independently:
- Pricing: What happens to your take-home if you raise prices 10%, but lose 15% of volume? Most operators are surprised to find net income goes up.
- Costs: What happens if your largest input cost rises 20%? This is not hypothetical — it is a typical 12-month swing in most industries.
- Volume: What happens at 70% of your planned volume for 90 days? If that still covers fixed costs, you have a real business. If not, the model is fragile.
Running the calculator three ways takes about ten minutes. The clarity on the other side of those ten minutes is usually the difference between a confident operating plan and guessing for another six months.
Frequently Asked Questions
How accurate is this calculator?
The underlying math uses industry-standard margin and cost ranges sourced from the Coffee Shop Revenue: What Owners Make vs. What You’d Expect space. Your actual numbers depend on location, seasonality, and operating style, so treat this as a directional benchmark, not a guarantee. The more precisely you enter your inputs, the tighter the output range becomes.
Can I save my results?
A free Digital Dashboard Hub account saves every scenario you run, lets you compare side-by-side, and unlocks the full dashboard with expense tracking and month-over-month charts. The 14-day trial includes the complete tool library — no credit card required to start.
Who is this tool for?
It’s built for anyone pressure-testing a real decision — existing operators auditing their margins, side-hustlers deciding whether to go full-time, and prospective owners trying to sanity-check a business plan before signing a lease. You do not need any accounting background to use it.
What should I do with the results?
Start by comparing the output against your current (or projected) monthly take-home. If the gap is big, walk back the inputs and identify which lever — pricing, volume, or cost structure — is doing the damage. That is usually where the highest-leverage fix lives.
The Bottom Line
Most operators lose money not because the math is impossible, but because they never actually ran it. Fifteen minutes with the calculator beats three months of guessing. Run your numbers, screenshot the output, and use it as the baseline for every pricing and cost decision over the next quarter.
When you are ready to go deeper, the full Digital Dashboard Hub workspace lets you save scenarios, track actuals month-over-month, and see the trend before problems compound. That is the version that actually compounds the effort — spreadsheets forgotten in a Google Drive folder do not.
Next Steps
- Run the calculator above with your best current estimates.
- Re-run it with a pessimistic scenario (lower volume, higher costs) and a stretch scenario (better pricing, more efficient ops).
- Screenshot all three outputs so you have a baseline to compare against when reality arrives.
- Revisit monthly — the number that matters is the one that changes with your real P&L.
Ready for the full dashboard?
Unlock all 255 tools across business, creator, and health workflows.
Andy Gaber is the founder of Digital Dashboard Hub, a suite of 255+ interactive financial, productivity, and wellness tools. He built DDH after getting frustrated with financial apps that gave outputs without context. Follow along for tool tutorials, revenue analytics breakdowns, and honest takes on personal finance.