Here’s a free driving school tool that actually works — no signup, no email capture wall, no “results hidden behind paywall” nonsense. Enter your numbers below and get instant results. If you want the full version with charts and reports, that’s available too.
About this article: I’m Andy, founder of Digital Dashboard Hub. I built DDH’s 255 free interactive tools to solve the specific financial, productivity, and wellness tracking gaps I kept seeing — starting with the problem this article covers. The free tool below is available without signup and works instantly. Try it and see your numbers in real time.
Use the Free Driving School Tool
Scroll down — the interactive tool runs live with your inputs. Full version lives inside Digital Dashboard Hub. Two-click trial, Stripe-secure.
I launched Digital Dashboard Hub because the tools I found online were either too generic or too complicated. Here’s the honest breakdown:
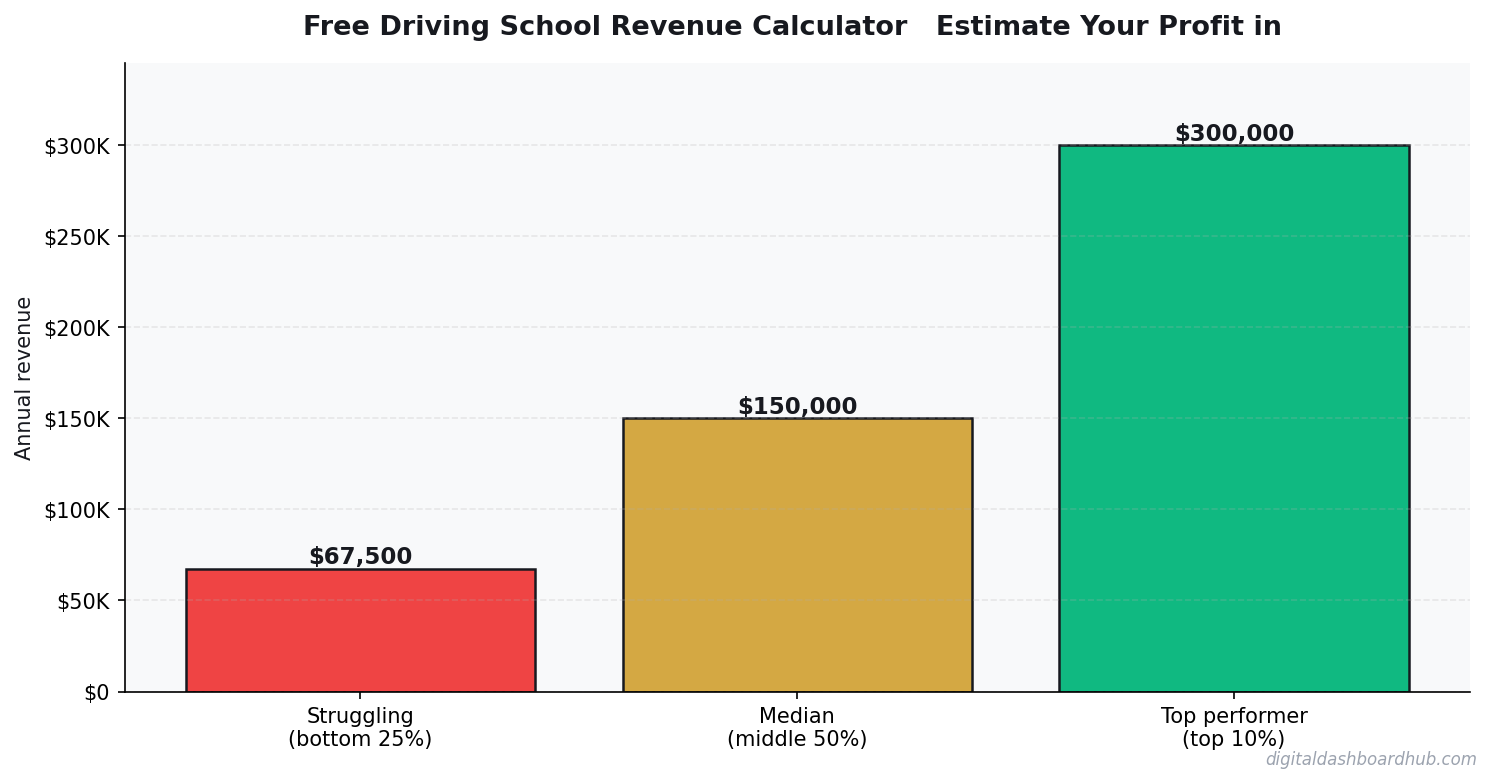
What Driving School Owners Actually Take Home
A driving school with 3-5 vehicles and 2-3 instructors grosses $15K-$30K/month. Vehicle costs ($2K-$5K total fleet), instructor wages ($18-$25/hr), insurance, and facility costs leave net margins at 25-35%.
Behind-the-wheel lessons at $60-$90/hr are the revenue driver, but classroom instruction at $200-$400/student with 20+ students is where the real margin lives.
Behind the Revenue Number
| Approach | Startup Cost | Time Investment | Revenue Potential | Best For |
|---|---|---|---|---|
| Solo operator | Low ($1K-$10K) | Full time | $60K-$200K/yr | Maximum margins, full control |
| Small team (2-5) | Medium ($10K-$50K) | Management + some fieldwork | $200K-$800K/yr | Scaling without losing control |
| DDH Revenue Tracker | Free trial | 5 min setup | N/A (profit tool) | Know your real numbers in real time |
The biggest line item? Vehicle costs — insurance at $400-$800/vehicle/month, gas, maintenance, and dual-control modifications — run $800-$1,500 per car per month.
Switching classroom to online eliminates rental ($500-$1,500/month) and lets you serve 3x the students per session. One-time production cost, recurring revenue.
The Trap That Catches Even Experienced Owners
Underpricing packages to compete on cost. Across 50 students/month, a $70 discount per package is $3,500 in lost revenue. Compete on pass rate and reviews, not price.
Summer is peak (teens out of school). January-February is the valley. Adult immigrant programs smooth seasonality with consistent demand and government subsidies.
Beyond the Calculator: The Full Dashboard
Want to save these projections and track them over time?
The full dashboard includes historical tracking, scenario modeling, and exportable reports.
255+ interactive tools included · No credit card required
How to Use This Calculator
Start by entering your actual numbers — not estimates. Pull from your bank statements, your POS system, or your accounting software. The difference between estimated and real inputs is usually the difference between “this looks fine” and “oh, that’s where the money is going.”
Then change one variable at a time. For driving school, the lever that usually moves the needle most is switching classroom to online eliminates rental ($500-$1,500/month) and lets you serve 3x the students per session. Start there.
If you want to save these projections, track them month-over-month, or model different scenarios side by side, the full dashboard does all of that. Free 14-day trial, no credit card required.
Your Next Move
Related Tools and Articles
- How to Budget as a Couple Without Fighting About Money (A Real Talk Guide)
- Free Side Hustle Income & Tax Tracker — Try It Now
- Why Traditional Budgets Fail ADHD Brains — And the Visual Tracker That Actually Works
Common Questions About Free Driving School Revenue Calculator — Estimate Your Profit in 60 Seconds
How long does it take to see results?
Most people see meaningful progress within 30-90 days when they apply these strategies consistently. The key is tracking your numbers from day one so you have a baseline to measure against.
What’s the biggest mistake people make?
Trying to do everything at once. Pick one or two strategies from this guide, implement them fully, then layer in additional tactics. Spreading yourself thin is the fastest way to see no results from any of it.
Do I need special tools or software?
Not necessarily to start — but the right tools eliminate hours of manual work. Our free calculators and trackers at Digital Dashboard Hub are a good starting point before you invest in paid software.
Keep reading (related guides):
255+ interactive tools for your money, time, and health.
14 days free · No charge today · 2-click cancel
What Most People Get Wrong
The single biggest mistake is treating revenue as the headline number. Revenue is vanity — margin is sanity, and cash-in-bank is reality. Two operators with identical top-lines routinely end the year $80K apart in take-home, because one priced for volume and the other priced for sustainability. The calculator above forces you to surface that gap before it hits your bank account.
The second mistake is modeling a “best case” and planning around it. The number you should plan around is the 30th-percentile scenario — enough demand to matter, but slower than you hoped. If the business still covers your living expenses there, you have real margin of safety. If it only works in the 80th-percentile case, you are building on sand.
The third mistake is ignoring your time as a cost. If you would otherwise earn $55/hr at a day job and this operation pays you effectively $18/hr for 60-hour weeks, the gap is the real price of running it. Plug your opportunity cost into the calculator and the picture often flips.
How to Pressure-Test Your Numbers
Start with the calculator, then stress-test three levers independently:
- Pricing: What happens to your take-home if you raise prices 10%, but lose 15% of volume? Most operators are surprised to find net income goes up.
- Costs: What happens if your largest input cost rises 20%? This is not hypothetical — it is a typical 12-month swing in most industries.
- Volume: What happens at 70% of your planned volume for 90 days? If that still covers fixed costs, you have a real business. If not, the model is fragile.
Running the calculator three ways takes about ten minutes. The clarity on the other side of those ten minutes is usually the difference between a confident operating plan and guessing for another six months.
Frequently Asked Questions
How accurate is this calculator?
The underlying math uses industry-standard margin and cost ranges sourced from the Free Driving School Revenue Calculator — Estimate Your Profit in 60 Seconds space. Your actual numbers depend on location, seasonality, and operating style, so treat this as a directional benchmark, not a guarantee. The more precisely you enter your inputs, the tighter the output range becomes.
Can I save my results?
A free Digital Dashboard Hub account saves every scenario you run, lets you compare side-by-side, and unlocks the full dashboard with expense tracking and month-over-month charts. The 14-day trial includes the complete tool library — no credit card required to start.
Who is this tool for?
It’s built for anyone pressure-testing a real decision — existing operators auditing their margins, side-hustlers deciding whether to go full-time, and prospective owners trying to sanity-check a business plan before signing a lease. You do not need any accounting background to use it.
What should I do with the results?
Start by comparing the output against your current (or projected) monthly take-home. If the gap is big, walk back the inputs and identify which lever — pricing, volume, or cost structure — is doing the damage. That is usually where the highest-leverage fix lives.
The Bottom Line
Most operators lose money not because the math is impossible, but because they never actually ran it. Fifteen minutes with the calculator beats three months of guessing. Run your numbers, screenshot the output, and use it as the baseline for every pricing and cost decision over the next quarter.
When you are ready to go deeper, the full Digital Dashboard Hub workspace lets you save scenarios, track actuals month-over-month, and see the trend before problems compound. That is the version that actually compounds the effort — spreadsheets forgotten in a Google Drive folder do not.
Next Steps
- Run the calculator above with your best current estimates.
- Re-run it with a pessimistic scenario (lower volume, higher costs) and a stretch scenario (better pricing, more efficient ops).
- Screenshot all three outputs so you have a baseline to compare against when reality arrives.
- Revisit monthly — the number that matters is the one that changes with your real P&L.
What the Numbers Actually Mean
Revenue, profit, and take-home pay tell three completely different stories, and conflating them is the fastest way to build a business plan that blows up on contact with reality. Revenue is the gross — what shows up on invoices and receipts before anyone pays anyone else. Profit is what remains after the cost of actually producing the service or product. Take-home is what lands in your personal account after taxes, self-employment contributions, benefits, and reinvestment.
The calculator above is specifically tuned to show the delta between those three layers, because that delta is where most operators get blindsided. A business can look like it is doing $400K/year and still pay its owner less than a middle-manager’s salary if the cost structure is wrong. Conversely, a modest $180K/year operation with disciplined costs can out-earn the flashy one in actual cash delivered to the owner’s household.
When you run your scenario, pay the most attention to the “after taxes and reinvestment” line rather than the top-line number. That is the line that determines whether this is a real livelihood or a time-expensive hobby that looks successful on Instagram.
Using the Tool With Your Own Data
The calculator delivers the most honest answer when you plug in real numbers from the last 90 days rather than aspirational ones. If you do not have 90 days of data yet, use the lowest plausible input for volume, the highest plausible input for each cost, and then run it again with your “most likely” estimates. The gap between those two runs is your planning buffer — that is the margin you have before you are in trouble.
Operators who do this exercise quarterly tend to outperform operators who only run the numbers once at the start and then reference outdated assumptions for the next 18 months. Markets change, input costs change, and your own operational efficiency changes. A static plan is a decaying one. Ten minutes with the calculator every quarter is enough to catch most problems while there is still runway to fix them.
If you are comparing two different business models or two pricing strategies, duplicate the scenario, change one variable, and compare. Isolating a single lever is how you learn which change actually moved the needle — this is the same approach good product teams use for A/B tests, and it applies to running a small business just as cleanly.
When to Revisit This
Come back to the calculator whenever one of these things changes: your pricing, your largest input cost, your volume (up or down by more than 20%), or your tax situation. Each of those variables moves the take-home line enough that the plan you had last quarter may no longer be the plan you need this quarter. Put a recurring 30-minute block on your calendar for the first week of every quarter and run the scenario fresh — it is the single highest-leverage business habit you can build.
Save your screenshots in a single folder labeled by date so you can see the trend across time. That folder becomes a ruthless honesty mirror when you are tempted to invest in growth spending or take on new fixed costs — does the next quarter actually support that move, or is it wishful thinking?
Ready for the full dashboard?
Unlock all 255 tools across business, creator, and health workflows.
Andy Gaber is the founder of Digital Dashboard Hub, a suite of 255+ interactive financial, productivity, and wellness tools. He built DDH after getting frustrated with financial apps that gave outputs without context. Follow along for tool tutorials, revenue analytics breakdowns, and honest takes on personal finance.