Use the free Auto Detailing Revenue Calculator below — plug in your real numbers and get instant results. No signup required for the lite version.
Try the Auto Detailing Revenue Calculator
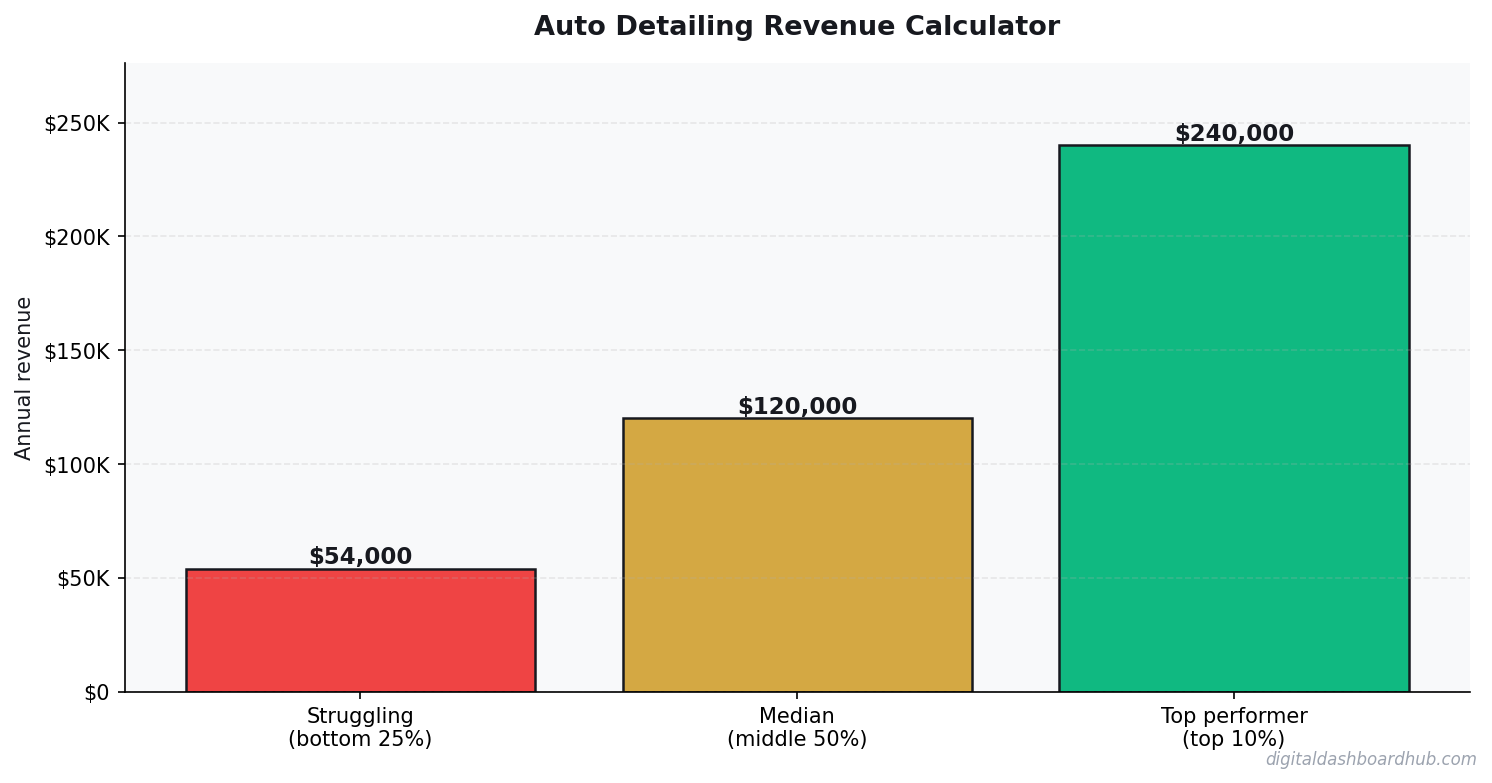
Auto Detailing Revenue Calculator
Enter your numbers below — results update instantly
Want the full Auto Detailing dashboard with expense tracking, break-even analysis, and growth projections?
Why This Matters
Running numbers in your head is how bad financial decisions happen. A quick calculation with real data beats a gut feeling every single time. I built this tool because I was tired of spreadsheet gymnastics just to answer basic questions about my finances.
The calculator above handles the basics. But if you need trend tracking, scenario comparison, and exportable reports — the full version inside Digital Dashboard Hub does all of that and more.
What You Get in the Full Dashboard
| Approach | Startup Cost | Time Investment | Revenue Potential | Best For |
|---|---|---|---|---|
| Solo operator | Low ($1K-$10K) | Full time | $60K-$200K/yr | Maximum margins, full control |
| Small team (2-5) | Medium ($10K-$50K) | Management + some fieldwork | $200K-$800K/yr | Scaling without losing control |
| DDH Revenue Tracker | Free trial | 5 min setup | N/A (profit tool) | Know your real numbers in real time |
The full Auto Detailing Revenue Calculator inside DDH includes features the lite version above can’t offer:
- Historical tracking — see your numbers change over weeks and months
- Visual charts — bar graphs, trend lines, and breakdowns that make patterns obvious
- Scenario modeling — “what if I change X?” comparisons side by side
- PDF reports — export professional reports for partners, lenders, or your own records
- — one subscription covers every calculator and tracker in the library
How to Use This Tool
Step 1: Enter your actual numbers in the fields above. Don’t guess — pull from your bank statements or business records for the most accurate results.
Step 2: Read the output cards. They update instantly as you type. Play with different scenarios to see how small changes affect your bottom line.
Step 3: If you want to save your results, track changes over time, or run more advanced projections — start a free 14-day trial of the full dashboard. No credit card required.
Your Next Move
You’ve already done the hardest part — you looked at your numbers instead of avoiding them. Here’s what to do with that momentum:
- Right now (30 seconds): Bookmark this page so you can rerun the calculation next month
- This week: Pull your real numbers from your accounts and run them through the calculator above
- Long game: Try the full DDH dashboard — 261 tools, 14 days free, cancel anytime
Keep Reading
- Nervous System Regulation Toolkit (TTW): Track, Understand, and Calm Your Autonomic Response
- The Complete Guide to Building Habits That Actually Stick (Using a Digital Habit Tracker)
- How to Build a Bulletproof Freelancer Finance System in 7 Steps (Even If Numbers Make You Nauseous)
Common Questions About Auto Detailing Revenue Calculator
How long does it take to see results?
Most people see meaningful progress within 30-90 days when they apply these strategies consistently. The key is tracking your numbers from day one so you have a baseline to measure against.
What’s the biggest mistake people make?
Trying to do everything at once. Pick one or two strategies from this guide, implement them fully, then layer in additional tactics. Spreading yourself thin is the fastest way to see no results from any of it.
Do I need special tools or software?
Not necessarily to start — but the right tools eliminate hours of manual work. Our free calculators and trackers at Digital Dashboard Hub are a good starting point before you invest in paid software.
What an Auto Detailing Business Actually Makes — Worked Example
A mobile detailer in a mid-size market, two years in, working solo.
Service mix: 4 full details/week at $225 average, 3 express washes at $65. Monthly gross: $4,700. Add 2 paint correction jobs/month at $450: $900. Monthly gross: $5,600 (~$67,200/year).
Costs: Products at 5% of revenue: $280/month. Van + insurance: $780. Business insurance: $110. DI filtration maintenance: $60. Fuel: $220. Total costs: $1,450/month. Net: ~$4,150/month ($49,800/year) working 5 days/week including travel time.
The 3 Factors That Move Detailing Revenue Most
1. Service tier positioning. Three clear options — a $129 maintenance detail, a $225 full interior/exterior, and a $450 paint correction — outperform 7-option menus in close rate and revenue per booking. Clear tiers make the buying decision easy and the upsell natural.
2. Membership and recurring customers. A customer booking a $65 express wash every 3 weeks is worth $1,100/year with almost no re-acquisition effort. Building a 40-client recurring base generates $3,500-4,500/month in predictable revenue before you book a single new customer. Push hard for recurring clients, not just one-time bookings.
3. Dealer and fleet accounts. A single dealership doing 15-20 vehicles/month at $120/unit is $1,800-2,400/month in steady volume. It pays weekly, it’s predictable, and it fills schedule gaps that would otherwise sit empty. One good dealer relationship can replace months of grinding for one-time bookings.
How Auto Detailing Businesses Build Real Profit Margins
Auto detailing is a high-labor business, and the operators who make good money are the ones who have systematized their service times to the minute. A full detail that takes one person 6 hours versus 4 hours is the difference between $200/day capacity and $300/day capacity — with identical product costs. Developing and drilling service checklists that standardize technique and timing is the most impactful operational move a detailing business can make.
Ceramic coating and paint protection film (PPF) are where the real margin lives in 2026 detailing. A ceramic coating job at $800–$1,500 has $80–$150 in product cost and 4–8 hours of labor. At $150/hour loaded labor cost, you’re still running 55–70% gross margin. Compared to a $150 full detail at similar margin math, the coating job generates 3–5x more revenue per booking slot. Shops that have built coating volume alongside traditional services have transformed their income ceiling.
Mobile detailing cuts overhead dramatically. No rent, no utilities, no buildout. A mobile operator with a well-equipped van running 4 jobs/day at $150 average ticket generates $2,400/week with overhead of $300–$400/week (fuel, supplies, insurance). That’s $2,000–$2,100/week in pre-tax income, or $100,000+/year, working 5 days. The tradeoff is physical intensity and weather dependency.
What Detailing Business Owners Actually Take Home
A solo mobile detailer working full-time typically grosses $60,000–$90,000/year and nets $45,000–$72,000 after expenses (fuel, supplies, insurance, equipment maintenance). A shop with 2–3 employed detailers and a manager grosses $300,000–$500,000 and might net the owner $80,000–$130,000 after payroll, rent, and overhead — less as a percentage but more in absolute dollars. The ceiling on a well-run multi-employee shop with coating services is significantly higher.
The costs that surprise new operators are equipment investment and replacement cycles. A quality dual-action polisher is $200–$400 and lasts 2–3 years with heavy use. Pressure washers, extractors, and ozone machines represent $3,000–$8,000 in startup equipment. Budget for 15–20% of initial equipment cost per year for replacement and upgrades — neglecting equipment maintenance is one of the most common ways detailers quietly bleed margin.
Repeat customer revenue is the business model most detailers under-invest in. A customer getting a full detail every 3 months at $175 is worth $700/year. Building a database of 100 regular customers who return on schedule generates $70,000/year from people who already trust you — with zero marketing cost beyond a reminder text. Most detailers focus on new customer acquisition and undervalue the compounding return on repeat business.
SaaS Metrics That Predict Revenue 90 Days Out
Most SaaS founders track lagging indicators — revenue, churn, MRR growth — and react after the damage is done. These three leading indicators give you a 60–90 day warning window:
Trial activation rate. The percentage of trials that complete your core onboarding action (not just sign up — actually use the product) predicts paid conversion rate almost perfectly. If activation drops 5 points, expect paid conversions to drop 2–3 points 30 days later. Fix activation before you spend more on acquisition.
Feature adoption breadth. Customers using 3+ features churn at roughly half the rate of customers using 1 feature. If new signups aren’t adopting secondary features within the first 14 days, your onboarding is creating single-feature customers who are one bad experience away from canceling.
Support ticket volume per customer. A rising ticket rate signals product confusion, which precedes churn by 4–6 weeks. Track it per cohort — if a specific month’s cohort is generating more tickets, something in that period’s onboarding or feature release broke the experience.
Keep reading (related guides):
Full features for 14 days · Secure payment · Stop anytime
Andy Gaber is the founder of Digital Dashboard Hub, a suite of 255+ interactive financial, productivity, and wellness tools. He built DDH after getting frustrated with financial apps that gave outputs without context. Follow along for tool tutorials, revenue analytics breakdowns, and honest takes on personal finance.