240+ Interactive Dashboard Tools
Budget trackers, ADHD planners, health dashboards — all in your browser
How Much You Actually Need to Retire: Run the Real Numbers
The 4% rule is the most widely used starting point. Take your annual spending in retirement, multiply by 25, and that’s your target portfolio. Spend $60,000/year: you need $1.5 million. Spend $80,000/year: you need $2 million. The logic is that a diversified portfolio historically sustains a 4% annual withdrawal indefinitely (based on the Trinity Study and its successors), meaning you could theoretically never run out of money.
That’s the theory. The practice is more nuanced. The 4% rule was validated on 30-year retirement horizons. If you retire at 55, you may need a 40-45 year runway — and the failure rates increase as time horizons extend. A 3.5% withdrawal rate gives you significantly more margin on a long retirement. For a $60,000/year spend, that means a $1.71 million target instead of $1.5 million.
The single biggest variable is your actual retirement spending — not your current spending. Retirees typically spend 20-30% less than they did while working: no commuting costs, no work wardrobe, the mortgage may be paid off, kids are independent. Modeling retirement spending at 75% of current spending rather than 100% can meaningfully change your target number — and your timeline.
Social Security and What It Actually Changes
The average Social Security benefit in 2025 is about $1,900/month for a retired worker. At $22,800/year, that covers a meaningful slice of expenses for many retirees — and it changes your portfolio target. If you’re spending $60,000/year and Social Security covers $22,800, your portfolio only needs to generate $37,200/year. That’s a $930,000 target at 4% instead of $1.5 million.
Delaying Social Security from 62 to 70 increases your monthly benefit by roughly 77%. That’s a guaranteed inflation-adjusted 8% annual return on the delayed years — better than almost any investment alternative. If you can bridge the gap from 62 to 70 on portfolio withdrawals, the higher Social Security benefit substantially reduces portfolio drawdown risk for the rest of your life.
Common Mistakes in Retirement Math
Ignoring inflation. At 2.5% annual inflation, $60,000 today requires $77,000 in 10 years to buy the same things. Your retirement income needs to grow, not hold flat. TIPS, I-Bonds, and dividend-growth equities all help — but the model needs to include inflation explicitly, not just hope it stays low.
Not accounting for healthcare. Pre-Medicare healthcare is the wildcard. A couple retiring at 62 and bridging to Medicare at 65 may face $18,000-$30,000/year in premiums and out-of-pocket costs. That’s a significant budget item that often gets underestimated or omitted entirely in retirement models.
Using only one scenario. Run three: conservative (lower returns, higher inflation, early healthcare costs), base (historical averages), and optimistic (higher returns, paid-off home, Social Security maximized). The range between conservative and optimistic usually spans $400K-$600K in portfolio target — knowing your exposure to that range is part of making a real decision, not just a comforting one.
The Three Numbers You Actually Need to Know
Most retirement planning articles give you formulas and percentages. Here are the three numbers that actually drive your target:
1. Your annual retirement spending estimate. Not your current spending — your retirement spending. No commuting, likely no mortgage by retirement, potentially lower housing costs if you downsize, no retirement savings contributions (obviously), and potentially lower tax burden. A reasonable starting estimate for many people is 70-80% of current gross income. Adjust up if you plan to travel extensively, down if your lifestyle will simplify.
2. Your expected retirement duration. If you retire at 65 and have family longevity suggesting 90-95 is plausible, you’re planning a 25-30 year drawdown. If you’re pursuing early retirement at 55, you’re planning 35-40 years. Every 5 years of additional retirement duration adds roughly 10-15% to your required portfolio under the 4% rule framework.
3. Your income floor from guaranteed sources. Social Security, pension, rental income — any income you’ll receive regardless of portfolio performance. This directly reduces the portfolio withdrawal required and therefore the target balance. Every $1,000/month in guaranteed income reduces your required retirement portfolio by approximately $300,000 at a 4% withdrawal rate.
Running the Three Scenarios
Conservative scenario: 3% real portfolio returns, 3% inflation, retire at 67, spend $75,000/year, Social Security at $24,000/year. You need your portfolio to cover $51,000/year. At a conservative 3.5% withdrawal rate, that’s a $1.46 million portfolio target.
Base scenario: 5% real returns, 2.5% inflation, retire at 65, spend $70,000/year, Social Security at $26,400/year. Portfolio covers $43,600/year. At 4% withdrawal: $1.09 million target.
Optimistic scenario: 6% real returns, 2% inflation, retire at 62, mortgage paid off reducing spending to $58,000/year, Social Security delayed to 70 at $36,000/year (post-70 only). Portfolio covers $22,000/year for 8 years, then $22,000/year ongoing after SS kicks in. Portfolio needed: substantially lower than either other scenario, maybe $800K if you can manage the 8-year bridge period.
The gap between these scenarios is enormous. Working 3 more years, paying off the mortgage, and delaying Social Security might reduce your portfolio target by $600,000. Those aren’t minor planning details — they’re the decisions that determine whether retirement is possible on your timeline.
The Savings Rate Reality Check
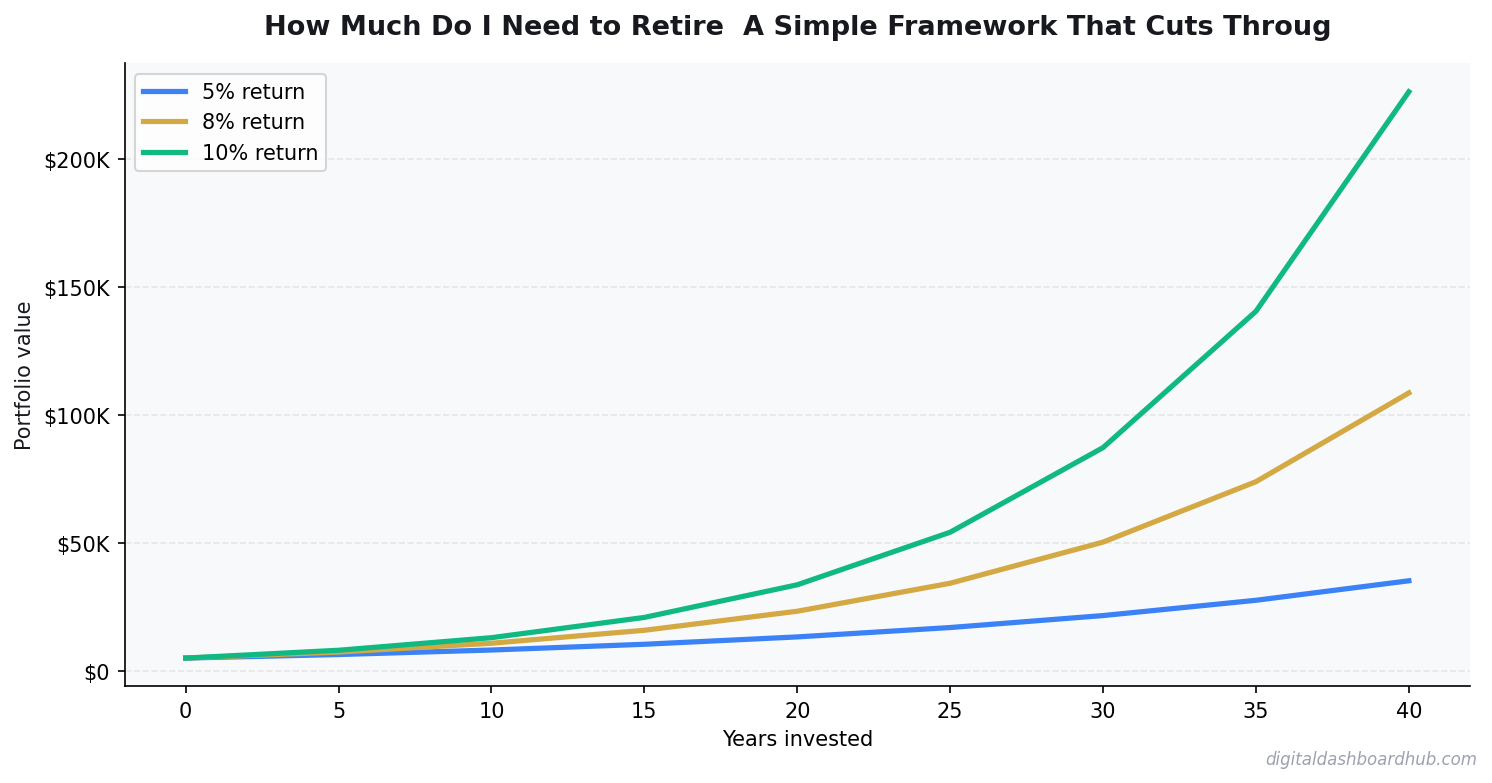
The math on compound growth is unforgiving about starting age. $500/month saved from age 25 at 7% average annual returns becomes approximately $1.37 million by age 65. The same $500/month starting at 35 becomes $607,000. Starting at 45: $262,000. A 10-year delay costs you more than half your ending balance — the same contributions, worse outcome.
The implication: the most impactful retirement planning decision most people can make before 40 is simply increasing their savings rate by 2-4 percentage points. Not picking better investments, not timing the market — just saving more, starting sooner. If you’re currently saving 6% of income toward retirement, getting to 10% by age 35 has a bigger lifetime impact than any investment optimization you could make.
The specific accounts matter less than the rate. Max your 401(k) match first (free money), then a Roth IRA if eligible ($7,000/year limit in 2025), then back to the 401(k) up to the annual limit ($23,500 in 2025), then taxable brokerage. The account type affects taxes; the contribution rate affects outcome.
What the Retirement Calculator Actually Shows You
The tool above helps you model your personal numbers rather than working from national averages. Plug in your actual current savings, your actual projected contributions, your realistic Social Security estimate (available through the SSA’s my Social Security account at ssa.gov), and your planned retirement age. The output gives you a target and a gap — and closing that gap is either a savings rate problem, a timeline problem, or both. Knowing which one lets you make decisions that are specific to your situation, not just directionally correct.
The One Question That Cuts Through the Complexity
If retirement planning feels overwhelming, simplify it to one question: am I on track to have enough saved to generate my required income floor by my target retirement date? The calculator above answers that question with your real numbers. If the answer is yes, you can fine-tune. If the answer is no, you know your gap — and you know whether closing it is a savings rate problem, a timeline problem, or both. That clarity is worth more than any amount of additional reading about retirement strategy.
The retirement number feels abstract until you connect it to specific decisions: how much more you need to save per paycheck, whether to delay Social Security, whether a paid-off mortgage changes the target. The calculator makes those connections visible. Use it not as a one-time check-in but as a tool to revisit annually — as income changes, as expenses change, and as the target date gets closer and the projections become real.
app.digitaldashboardhub.com
Try This Tool Free
Interactive dashboard — no account required to preview
Download Our Free Retirement Number Calculator
We built a free Retirement Number Calculator that takes your annual spending, desired retirement age, and current savings — and shows you exactly how much you need, how much to save monthly, and when you’ll hit your target.
Enter your email below and we’ll send it to you immediately.
Keep Reading
- I Tested 9 Expense Tracker Apps for 3 Months — Here’s What Actually Worked
- Freelancer Finance Management Dashboard (VVS): Finally, a Money Tool Built for Variable Income
- Airbnb Revenue Calculator: Estimate Your Short-Term Rental Income Before You List
Keep reading (related guides):
- Never Work Again Calculator: The Exact Number by Age
- How Much Money You Need to Retire Early at 40, 45, and 50 (Real Numbers by Age)
- Inventory Stock Level Tracker: Stop Running Out of Your Best Sellers
- Investing for Beginners: How to Start With Just $50 (And Actually Understand What Youre Doing)
- Etsy Seller Revenue Calculator: Project Your Monthly Shop Income
255+ interactive tools for your money, time, and health.
Full dashboard access · Stripe-secure checkout · Cancel anytime
240+ Interactive Dashboard Tools
Budget trackers, ADHD planners, health dashboards — all in your browser
Andy Gaber is the founder of Digital Dashboard Hub, a suite of 255+ interactive financial, productivity, and wellness tools. He built DDH after getting frustrated with financial apps that gave outputs without context. Follow along for tool tutorials, revenue analytics breakdowns, and honest takes on personal finance.