Use the free Boutique Revenue Calculator below — plug in your real numbers and get instant results. No signup required for the lite version.
Try the Boutique Revenue Calculator
Before you scroll: the calculator below is running in your browser right now. For the full feature set — saved scenarios, history, exports — open the dashboard.
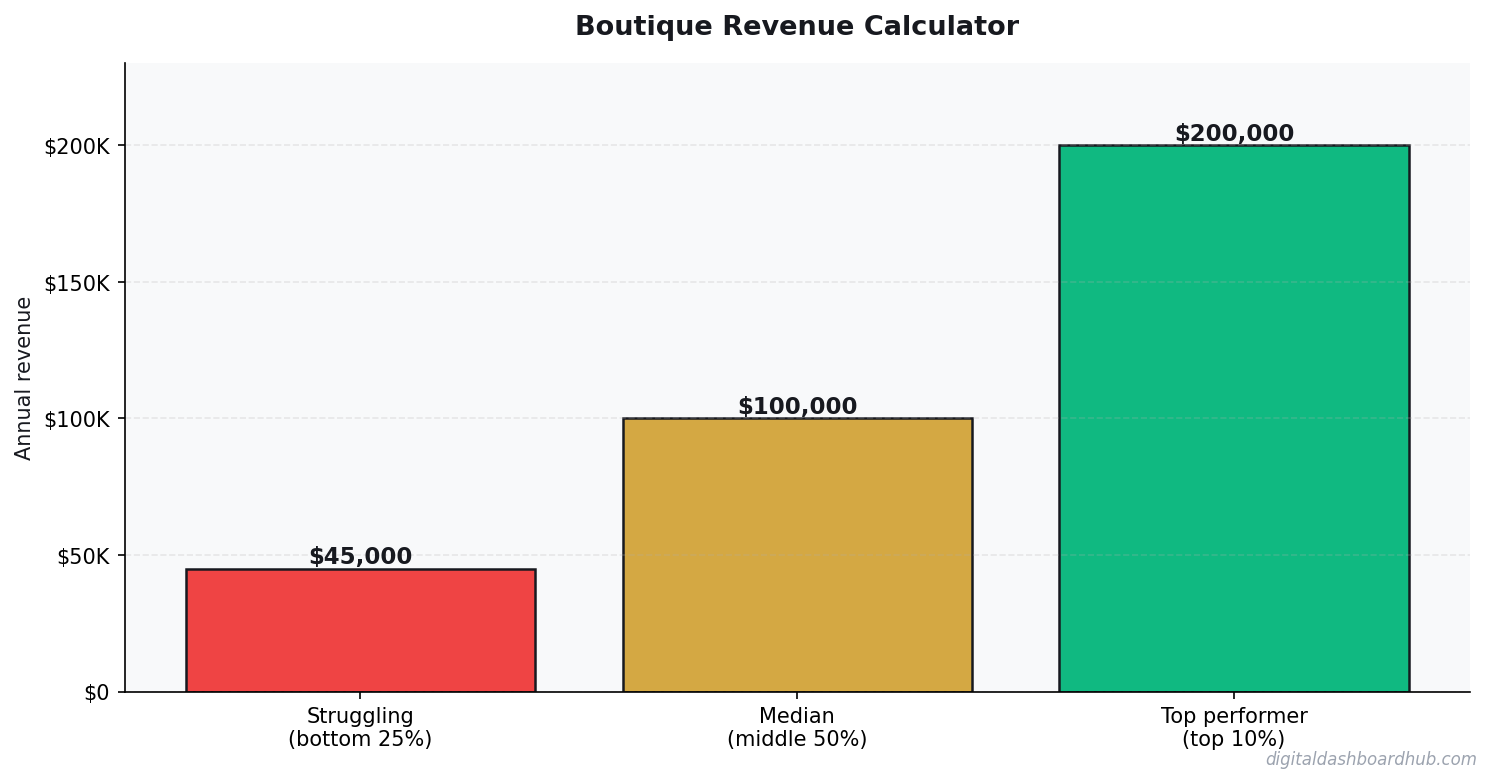
Boutique Revenue Calculator
Enter your numbers below — results update instantly
Want the full Boutique dashboard with expense tracking, break-even analysis, and growth projections?
Why This Matters
Running numbers in your head is how bad financial decisions happen. A quick calculation with real data beats a gut feeling every single time. I built this tool because I was tired of spreadsheet gymnastics just to answer basic questions about my finances.
The calculator above handles the basics. But if you need trend tracking, scenario comparison, and exportable reports — the full version inside Digital Dashboard Hub does all of that and more.
What You Get in the Full Dashboard
| Approach | Startup Cost | Time Investment | Revenue Potential | Best For |
|---|---|---|---|---|
| Solo operator | Low ($1K-$10K) | Full time | $60K-$200K/yr | Maximum margins, full control |
| Small team (2-5) | Medium ($10K-$50K) | Management + some fieldwork | $200K-$800K/yr | Scaling without losing control |
| DDH Revenue Tracker | Free trial | 5 min setup | N/A (profit tool) | Know your real numbers in real time |
The full Boutique Revenue Calculator inside DDH includes features the lite version above can’t offer:
- Historical tracking — see your numbers change over weeks and months
- Visual charts — bar graphs, trend lines, and breakdowns that make patterns obvious
- Scenario modeling — “what if I change X?” comparisons side by side
- PDF reports — export professional reports for partners, lenders, or your own records
- — one subscription covers every calculator and tracker in the library
How to Use This Tool
Step 1: Enter your actual numbers in the fields above. Don’t guess — pull from your bank statements or business records for the most accurate results.
Step 2: Read the output cards. They update instantly as you type. Play with different scenarios to see how small changes affect your bottom line.
Step 3: If you want to save your results, track changes over time, or run more advanced projections — start a free 14-day trial of the full dashboard. No credit card required.
Your Next Move
You’ve already done the hardest part — you looked at your numbers instead of avoiding them. Here’s what to do with that momentum:
- Right now (30 seconds): Bookmark this page so you can rerun the calculation next month
- This week: Pull your real numbers from your accounts and run them through the calculator above
- Long game: Try the full DDH dashboard — 261 tools, 14 days free, cancel anytime
More to Explore
- How to Budget as a Couple Without Fighting About Money (A Real Talk Guide)
- Small Business Finance Basics: The Only 5 Numbers You Need to Track Weekly
- True Cost of Your Mortgage Calculator: It’s More Than the Payment
Common Questions About Boutique Revenue Calculator
How long does it take to see results?
Most people see meaningful progress within 30-90 days when they apply these strategies consistently. The key is tracking your numbers from day one so you have a baseline to measure against.
What’s the biggest mistake people make?
Trying to do everything at once. Pick one or two strategies from this guide, implement them fully, then layer in additional tactics. Spreading yourself thin is the fastest way to see no results from any of it.
Do I need special tools or software?
Not necessarily to start — but the right tools eliminate hours of manual work. Our free calculators and trackers at Digital Dashboard Hub are a good starting point before you invest in paid software.
What a Boutique Actually Nets — Worked Example
A women’s clothing boutique in a mid-size market, 900 sq ft, $35,000/month gross. Here’s the actual P&L.
Gross: $35,000. COGS at 42.5%: ~$14,875. Gross profit: ~$20,125. Rent: $3,800. Labor (1 FT + 2 PT): $6,400. Marketing: $800. Credit card fees (3%): $1,050. Supplies and misc: $420. Total operating expenses: $12,470. Net operating profit: ~$7,655/month — the owner’s pre-tax income if they’re doing most of the work.
That number looks okay until you factor in inventory risk. A $12,000 buying order that doesn’t sell through will cost $3,000-4,000 in markdown margin. One bad buying decision can erase a quarter of profit.
The 3 Factors That Move Boutique Revenue Most
1. Sell-through rate. Moving 85%+ at full price vs. 65% with heavy markdowns is the entire difference between a healthy and struggling boutique. Buying discipline matters more than marketing spend.
2. Average transaction value. Staff training on outfit building — not hard-selling — increases ATV by 30-50%. This is the highest-ROI investment a boutique owner can make. A customer spending $145 vs. $85 per visit is the whole business model difference.
3. Local social presence converting to foot traffic. For boutiques, Instagram and TikTok are awareness channels that drive walk-ins. Shops with active social presence see measurable foot traffic increases in the 72 hours after a post. Local social is worth more per hour than any paid advertising at this revenue scale.
Why Boutique Retail Margins Are Tighter Than They Look
Clothing boutiques typically buy inventory at keystone (50% of retail), meaning a $60 top costs $30 wholesale. That 50% gross margin sounds healthy until you subtract rent (12–18% of revenue in most retail formulas), labor (20–25%), credit card processing (2.5–3%), shrinkage and returns (3–5%), and marketing. After all that, most boutiques net 5–12% — and that’s before the owner pays themselves a real wage.
The biggest margin killer beyond rent is unsold inventory. A boutique that buys $30,000 in seasonal inventory and sells $22,000 at full price, then clears $6,000 at 40% off, has effectively generated a much lower margin than the initial keystoning suggested. Inventory management — buying depth on proven sellers rather than breadth across 60 SKUs — is the most direct lever on profitability that most boutique owners underuse.
Online sales change the math in both directions. You save on floor space but add shipping, returns, and photography costs. A boutique doing $15,000/month online at 45% margin after shipping, packaging, and platform fees is doing well. But you need an audience to sell to, and building that audience costs time and money that doesn’t show up as a line item until it’s already been spent.
How Boutique Owners Build Revenue Beyond the Rack
The boutiques I’ve seen crossing $400K–$600K in annual revenue have usually added at least one non-inventory revenue stream. Personal styling consultations ($75–$200/session) have near-zero cost and build customer loyalty. A shop owner doing 4 styling sessions per week adds $15,600–$41,600/year without adding inventory risk.
Pop-up events and trunk shows create urgency and drive customer acquisition that passive retail never achieves. A well-run trunk show with a new vendor can do $3,000–$8,000 in a single weekend in a shop that averages $600/day normally. The vendor pays for the event marketing, you collect the margin on everything sold through your space.
Private label is the long-game move for boutique owners who want to stop competing on product. Sourcing basics — tees, loungewear, accessories — under your own brand gives you 60–70% margins versus 45–50% on branded wholesale. Even replacing 20% of your inventory with private label product can shift total gross margin meaningfully over a full year.
SaaS Metrics That Predict Revenue 90 Days Out
Most SaaS founders track lagging indicators — revenue, churn, MRR growth — and react after the damage is done. These three leading indicators give you a 60–90 day warning window:
Trial activation rate. The percentage of trials that complete your core onboarding action (not just sign up — actually use the product) predicts paid conversion rate almost perfectly. If activation drops 5 points, expect paid conversions to drop 2–3 points 30 days later. Fix activation before you spend more on acquisition.
Feature adoption breadth. Customers using 3+ features churn at roughly half the rate of customers using 1 feature. If new signups aren’t adopting secondary features within the first 14 days, your onboarding is creating single-feature customers who are one bad experience away from canceling.
Support ticket volume per customer. A rising ticket rate signals product confusion, which precedes churn by 4–6 weeks. Track it per cohort — if a specific month’s cohort is generating more tickets, something in that period’s onboarding or feature release broke the experience.
Keep reading (related guides):
14-day trial · Stripe checkout · Cancel anytime
Andy Gaber is the founder of Digital Dashboard Hub, a suite of 255+ interactive financial, productivity, and wellness tools. He built DDH after getting frustrated with financial apps that gave outputs without context. Follow along for tool tutorials, revenue analytics breakdowns, and honest takes on personal finance.